What you’ll take away
- Concentration rejection compares the named constituent in the feed and permeate; recovery compares liquid flows.
- In the original example, 98% rejection and 60% recovery give 1.2% solute mass passage.
- The concentrate carries 1,976 mg/h in 8 L/h, giving 247 mg/L under the declared balance.
- An equal rejection percentage does not fix the concentrate concentration or the amount of water recovered.
- Blending and auxiliary water use change the reporting boundary and require matching denominators.
- A calculated balance does not establish drinking-water suitability, real device performance or the cause of a measurement discrepancy.
A percentage needs a named quantity
A water-treatment description says 98 percent salt rejection. Another line says 60 percent recovery. Those figures can both be correct. One compares the concentration of a dissolved substance in two streams; the other compares how much water enters and leaves through a particular outlet. Treating them as competing ratings hides the question each number answers.
Reverse osmosis is a pressure-driven separation process using a semipermeable membrane. The portion passing through the membrane is called permeate, while a separate continuing stream carries the concentrate [1][2]. The concentrate is part of the material account, even when attention is focused on the permeate. A lower concentration in one outlet does not mean the dissolved material has disappeared.
We will follow an invented, steady two-outlet module and one conservative dissolved constituent. Conservative means it is neither created nor destroyed in our example. The assigned values are for explanation, not readings from a tested purifier. They will show why concentration rejection, water recovery and the fraction of solute entering the permeate are three different percentages. They do not establish drinking-water suitability or a treatment operating procedure.
A concentration-rejection figure and a water-recovery figure have different numerators and denominators. The distinction is visible in a simple reverse-osmosis control volume: one feed enters, while permeate and concentrate leave. EPA and DuPont describe these separate outlets in their membrane-process explanations [1][2]. EPA’s WaterSense guide defines recovery using permeate relative to feed water [3].
For this article, define bulk concentration rejection for a named constituent as R=1−C_p/C_f, with C_f>0. Define volumetric recovery as Y=Q_p/Q_f, with Q_f>0. These definitions identify the two sampling streams and the flow boundary; R is not an inferred intrinsic membrane selectivity. The original fixture assumes steady operation, a conservative solute, no accumulation, reaction, leaks or unlisted streams, and a dilute equal-density approximation in which liquid volumes are additive.
Exact rational bookkeeping will connect R and Y to solute mass passage and concentrate concentration. No membrane constitutive model, product test, operating-pressure recommendation or water-quality compliance assessment is performed. The explanation concerns what follows from the declared stream records, rather than whether a particular treatment system achieves them.
Give every stream a flow and a concentration
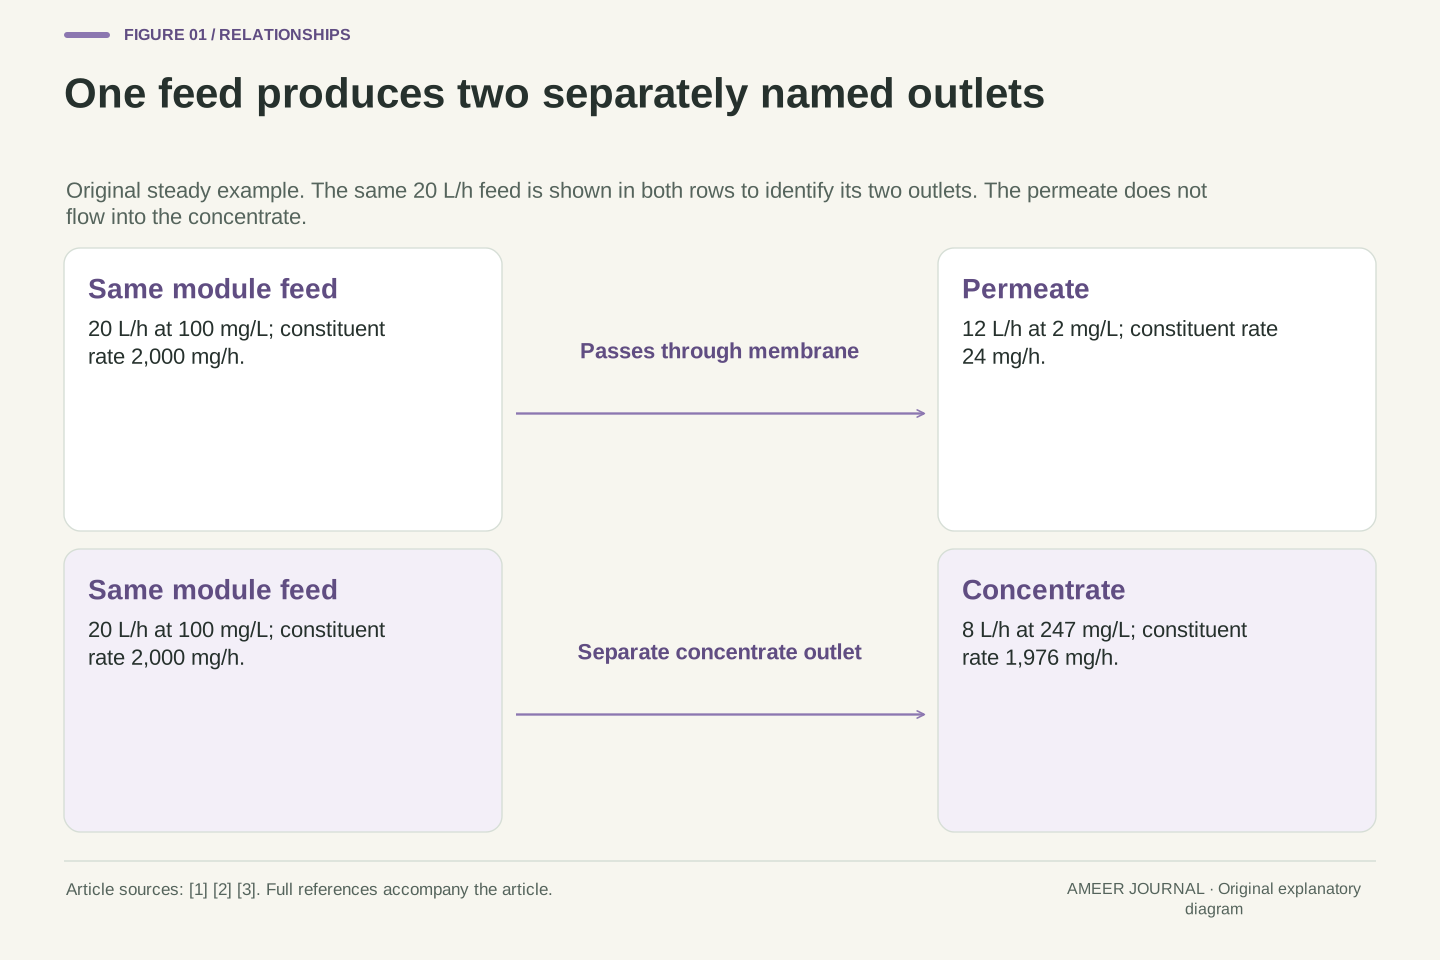
Assign the feed a flow of 20 litres per hour and a concentration of 100 milligrams per litre of our chosen constituent. Assign the permeate 12 litres per hour at 2 milligrams per litre. Under our two-outlet volume account, the remaining 8 litres per hour leave as concentrate. Its concentration is still unknown; we will calculate it from the dissolved-material balance.
Litres per hour describes how much liquid crosses a boundary in a given time. Milligrams per litre describes how much of the chosen substance accompanies each litre. A stream can therefore have a high concentration but a small flow, or a low concentration but a large flow. Both labels are needed to find the amount of material carried per hour.
Keep the records aligned. The feed and permeate values refer to the same steady case, constituent and concentration units. EPA’s guidance discusses meters on incoming feed and permeate lines when assessing recovery [3]. The location of those lines matters: a number taken after another stream is mixed in would describe a different outlet.
Set Q_f=20 L/h, C_f=100 mg/L, Q_p=12 L/h and C_p=2 mg/L. The stipulated volumetric balance Q_f=Q_p+Q_c gives Q_c=8 L/h. The concentration C_c remains to be inferred. Subscripts f, p and c identify feed, permeate and concentrate, respectively; Q is volume per time and C is solute mass per volume.
The equal-density, additive-volume approximation is explicit. An exact liquid mass balance outside that approximation would require the relevant densities rather than silently adding unequal-density volume flows. Here, the simple volume equation is part of the original fixture and is consistent with the dilute concentrations selected. It does not replace the separate solute mass balance.
All stream values describe the same stationary interval and constituent. This avoids pairing a feed concentration from one condition with a permeate concentration from another. The WaterSense discussion of feed and permeate meters supports the importance of named measurement locations [3]; the present numbers are assigned records rather than measurements from those meters. Changing a boundary later will be introduced as a separate case.
Read 98 percent as a concentration comparison
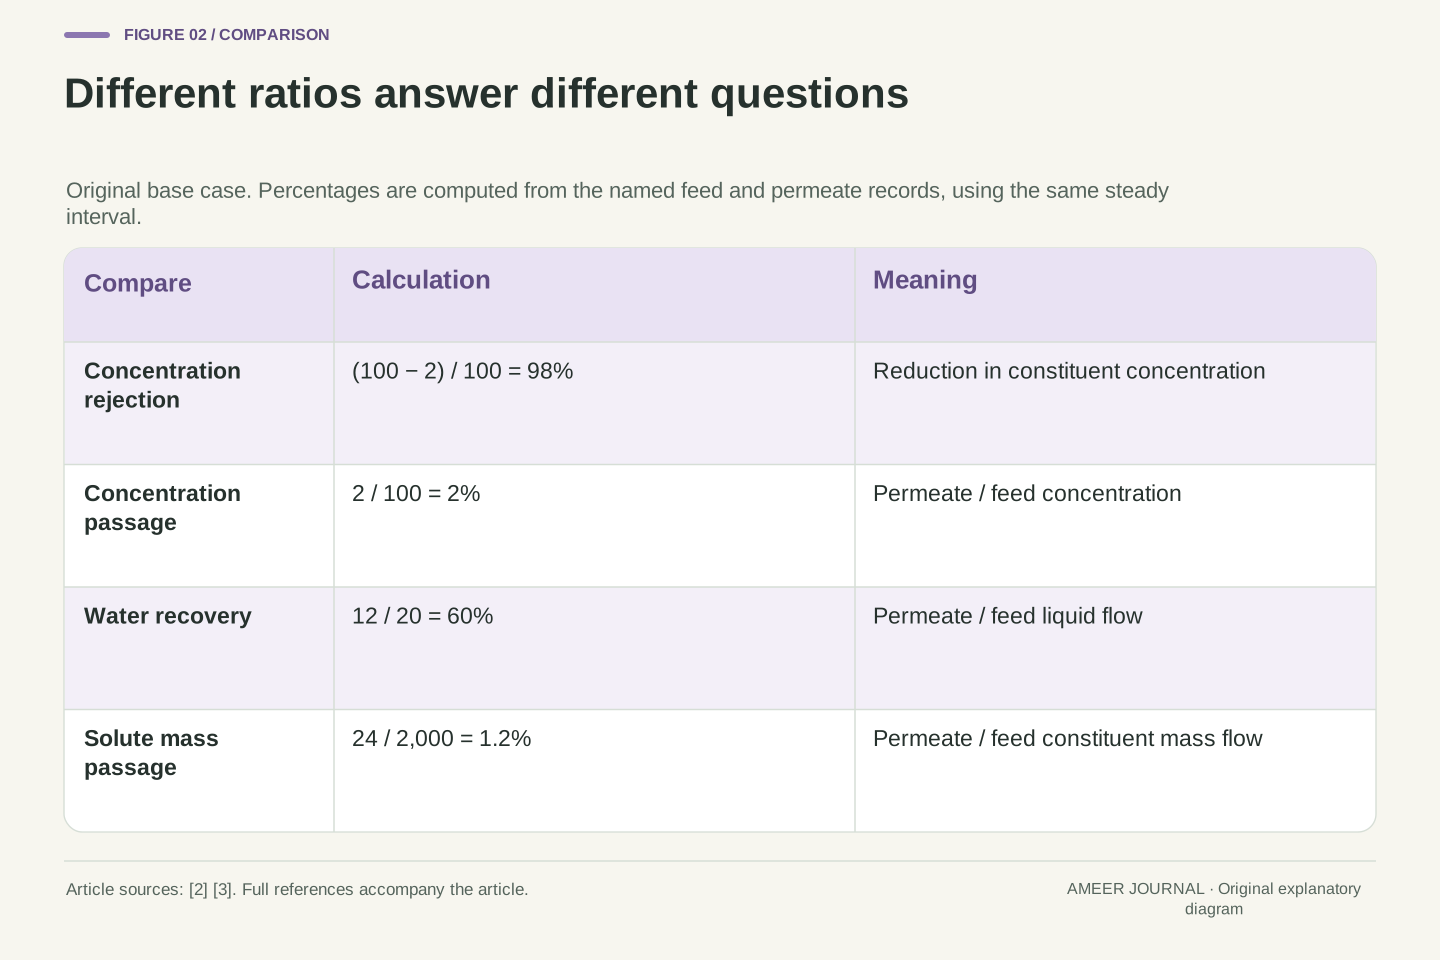
The concentration falls from 100 to 2 milligrams per litre between the named feed and permeate. The reduction is 98 milligrams per litre. Divide that reduction by the feed concentration of 100 milligrams per litre and the result is 98 percent. This is the concentration-rejection definition used in our example.
The remaining concentration ratio is 2 divided by 100, or 2 percent. That means a litre of this permeate contains two percent as much of the constituent as a litre of this feed. It does not say that two percent of all the incoming constituent leaves in the permeate each hour. The number of litres in those two streams is different.
A rejection label also needs its constituent and conditions. DuPont describes rejection as dependent on membrane type, feed composition, temperature and system design [2]. Our 98 percent is an assigned ratio for the named streams. It is not a product rating, a claim that every dissolved substance behaves identically, or a promise that the same ratio persists after an operating change.
The declared bulk concentration ratio gives R=(C_f−C_p)/C_f=(100−2)/100=49/50=0.98. Its complement, C_p/C_f=1−R=1/50, is a concentration passage ratio. Both are dimensionless because the concentrations use the same mass-per-volume units. Neither expression contains a flow term.
That omission is decisive. R alone cannot specify a solute mass-flow fraction or a water-output fraction. It also belongs to the stated bulk feed/permeate boundary; substituting a different reference concentration would define a different comparison. We do not infer membrane-surface concentrations, concentration polarization or intrinsic transport parameters from these two bulk values.
The manufacturer’s overview identifies membrane, feed and operating conditions as influences on reported rejection [2]. The fixture supplies a particular ratio without predicting those dependencies. Later comparisons holding R fixed will be separately assigned stream records, not a claim that altering recovery on a real device leaves its rejection unchanged. Keeping definition and physical prediction separate makes the arithmetic usable without turning it into an unsupported membrane-performance model.
Read 60 percent as an outlet-flow comparison
Twelve of the twenty litres entering per hour leave through the permeate outlet. Divide 12 by 20 to obtain 0.6, or 60 percent recovery. This follows the permeate-to-feed definition in EPA’s WaterSense guide [3]. The concentration values of 100 and 2 milligrams per litre are not used in that calculation.
The concentrate receives the other eight litres per hour, so its share is 8 divided by 20, or 40 percent. In this specific two-outlet account, 60 and 40 percent add to 100. That complement depends on our declared boundary: it contains no additional inlet, cleaning-water outlet or changing stored volume.
Over one hour of the stated steady case, the rates correspond to 20 litres entering, 12 litres becoming permeate and 8 litres becoming concentrate. Choosing a shorter matching interval would give the same recovery. Comparing a full day of feed with only one hour of permeate would not. A ratio is meaningful only when its two records describe compatible time windows.
Volumetric recovery is Y=Q_p/Q_f=12/20=3/5=0.60. The concentrate flow fraction is Q_c/Q_f=8/20=2/5. Their sum is one because Q_f=Q_p+Q_c under the defined volume approximation. This is the feed/permeate recovery relationship described in the March 2024 WaterSense guide [3].
For a common interval Δt during steady operation, V_p/V_f=(Q_pΔt)/(Q_fΔt)=Y. Time cancels only because both records use the same interval and fixed rates. For time-varying operation, a ratio of accumulated volumes requires integration over a shared window; it should not be inferred by combining unrelated instantaneous readings.
This section concerns liquid recovery rather than solute selectivity. A change in C_p with both flows fixed would change R but leave Y unchanged in the account. Conversely, two assigned records can share the same concentration ratio while having different Y. The complement 1−Y represents this module’s concentrate-flow fraction, not an unrestricted statement about every flow crossing an entire treatment facility.
Multiply concentration by flow to follow the dissolved material
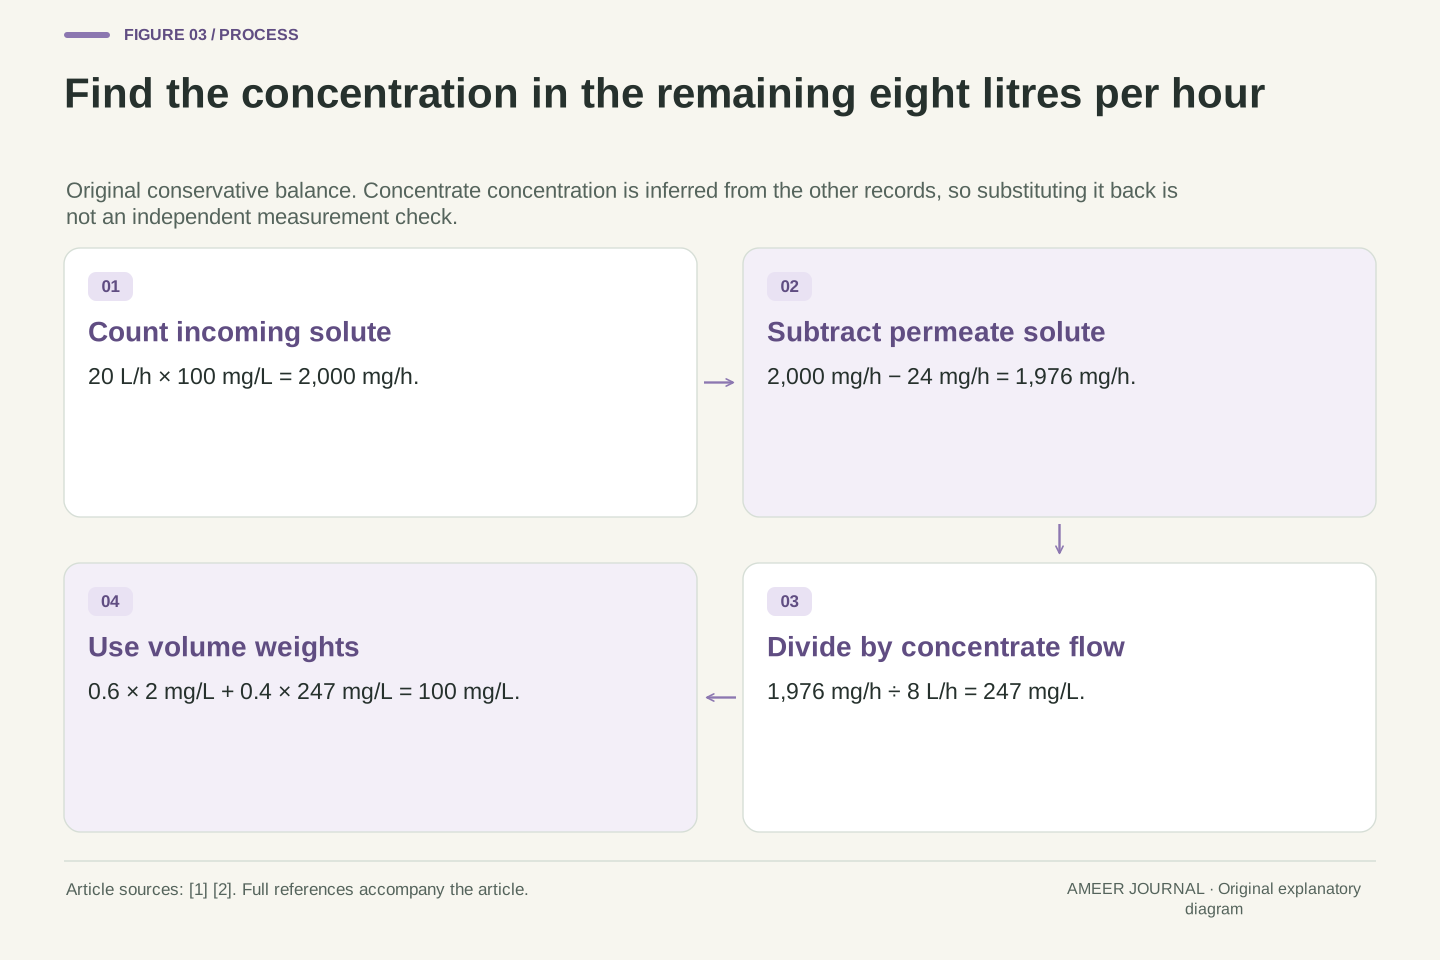
Each feed litre carries 100 milligrams, and twenty litres arrive per hour. The incoming constituent rate is therefore 20×100=2,000 milligrams per hour. Each permeate litre carries 2 milligrams, and twelve litres leave per hour, giving 12×2=24 milligrams per hour. Now the quantities being compared have the same meaning: material carried per hour.
Divide 24 by 2,000. Only 1.2 percent of the incoming constituent mass enters the permeate in this example. That is different from the 2 percent concentration ratio because the permeate contains only 60 percent of the incoming liquid volume. Multiplying 60 percent by 2 percent gives 1.2 percent.
The remaining constituent rate is 2,000−24=1,976 milligrams per hour, or 98.8 percent of the incoming amount. Our conservative balance places it in the concentrate. EPA’s process description identifies that outlet as carrying separated constituents [1]. Calling them rejected does not mean they were destroyed, and this arithmetic gives no instruction about using or disposing of the concentrate.
Solute mass flow is Q C: (L/h)(mg/L)=mg/h. Thus the feed carries 2,000 mg/h and the permeate carries 24 mg/h. With no accumulation or source term, Q_f C_f=Q_p C_p+Q_c C_c. The concentrate must carry the residual 1,976 mg/h.
The solute mass-passage fraction is F_p=Q_p C_p/(Q_f C_f)=24/2000=3/250=0.012. Substituting the definitions gives F_p=Y(1−R). Its complement, 1−F_p=247/250=0.988, is the fraction leaving through the concentrate under this conservative two-outlet model. It is not the concentration rejection R=0.98.
The identities distinguish concentration selectivity from material allocation. Even perfect bookkeeping does not turn separation into chemical destruction; the constituent remains represented in the outlet balance [1][2]. A useful report should therefore name whether a percentage describes C_p/C_f, Q_p/Q_f or Q_p C_p/(Q_f C_f). Their similar-looking ratios do not share interchangeable denominators. All three can be computed from the same four assigned feed/permeate quantities.
The remaining material travels in a smaller volume
The concentrate carries 1,976 milligrams per hour in eight litres per hour. Divide the material rate by the liquid rate: 1,976÷8=247 milligrams per litre. This is higher than the feed’s 100 milligrams per litre because most of the constituent leaves in a smaller liquid volume. The word concentrate now has a numerical meaning in the account.
Check the result using the two outlet shares. Sixty percent of the outgoing volume has concentration 2, and forty percent has concentration 247. Their weighted concentration is 0.6×2+0.4×247=100 milligrams per litre, matching the feed. The plain average of 2 and 247 is 124.5, which would incorrectly give both streams equal weight.
This 247 value was calculated from the assumptions and the other records. It is not an independently observed concentrate measurement. If we later use a separate concentrate reading to check the balance, it must provide genuinely additional information; repeating the number inferred by the balance would only repeat the same calculation.
Solve C_c=(Q_f C_f−Q_p C_p)/Q_c=1976/8=247 mg/L. Dividing through by Q_f C_f gives C_c/C_f=[1−Y(1−R)]/(1−Y), valid here for C_f>0 and 0<Y<1. The numerator tracks the solute fraction routed to concentrate; the denominator tracks its liquid-volume fraction.
The equivalent mixture check is C_f=Y C_p+(1−Y)C_c=0.6·2+0.4·247=100 mg/L. An unweighted arithmetic mean would assume equal outlet volumes and is inappropriate for the 12:8 split. The equations are derived from the original conservation assumptions, not from a fitted membrane model.
At Y=1, this concentrate formula is undefined. A positive retained-solute rate cannot leave through a nonexistent concentrate outlet while maintaining all the same steady, conservative assumptions. That algebraic boundary is not a prediction that a real system reaches an arbitrarily large concentration. It identifies where the assumed two-outlet description ceases to supply a finite solution. The inferred C_c also remains a derived quantity until an independent record is introduced.
The same rejection can accompany different recoveries
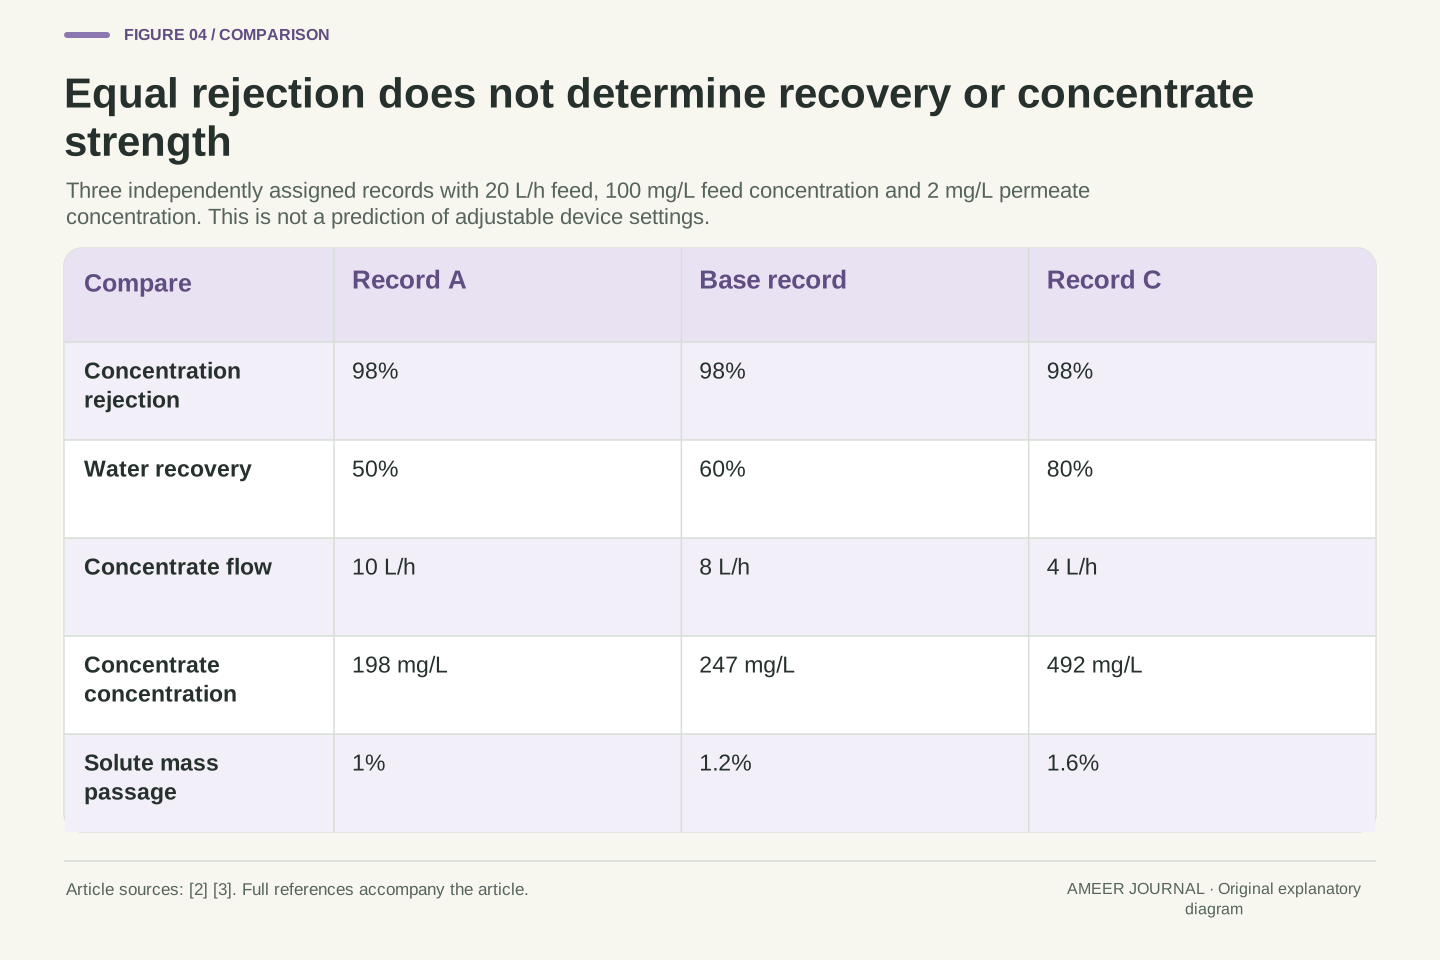
Compare three separately assigned records, all with a feed concentration of 100 and a permeate concentration of 2 milligrams per litre. Each therefore has 98 percent concentration rejection. Keep the feed at 20 litres per hour, but assign permeate flows of 10, 12 and 16 litres per hour. Their recoveries are 50, 60 and 80 percent.
The concentrate flows become 10, 8 and 4 litres per hour. Applying the material balance gives concentrate concentrations of 198, 247 and 492 milligrams per litre. The percentages of incoming constituent entering the permeate are 1, 1.2 and 1.6 percent. Equal rejection has not fixed either of those other results.
These are accounting comparisons, not settings to try on a purifier. Actual recovery and rejection depend on the membrane, incoming water and system conditions [2][3]. Holding one ratio constant in three invented records does not demonstrate that a real device can move between those records, or establish which record uses less energy or is preferable.
For independent records with Q_f=20 L/h, C_f=100 mg/L and C_p=2 mg/L, assign Y=1/2,3/5,4/5. Then Q_p=10,12,16 L/h and Q_c=10,8,4 L/h. All retain R=49/50. Their concentrate values are 198,247,492 mg/L, while F_p=Y/50 gives 1%,1.2%,1.6%.
The table demonstrates non-equivalence of the metrics rather than a controlled physical intervention. In particular, no constitutive relation has been supplied that makes C_p stay at 2 mg/L while recovery changes. The source descriptions identify operating and feed dependencies [2][3]; they do not validate these three records as attainable states of one membrane.
There is consequently no energy ranking or optimum in this calculation. Pump power, pressure, membrane area and actual operating constraints are absent. The legitimate conclusion is narrower: knowing R alone does not determine Y, F_p or C_c. Adding the flow ratio closes those quantities within the stated conservative model, while feasibility and performance require further evidence.
One constituent’s percentage does not describe every substance
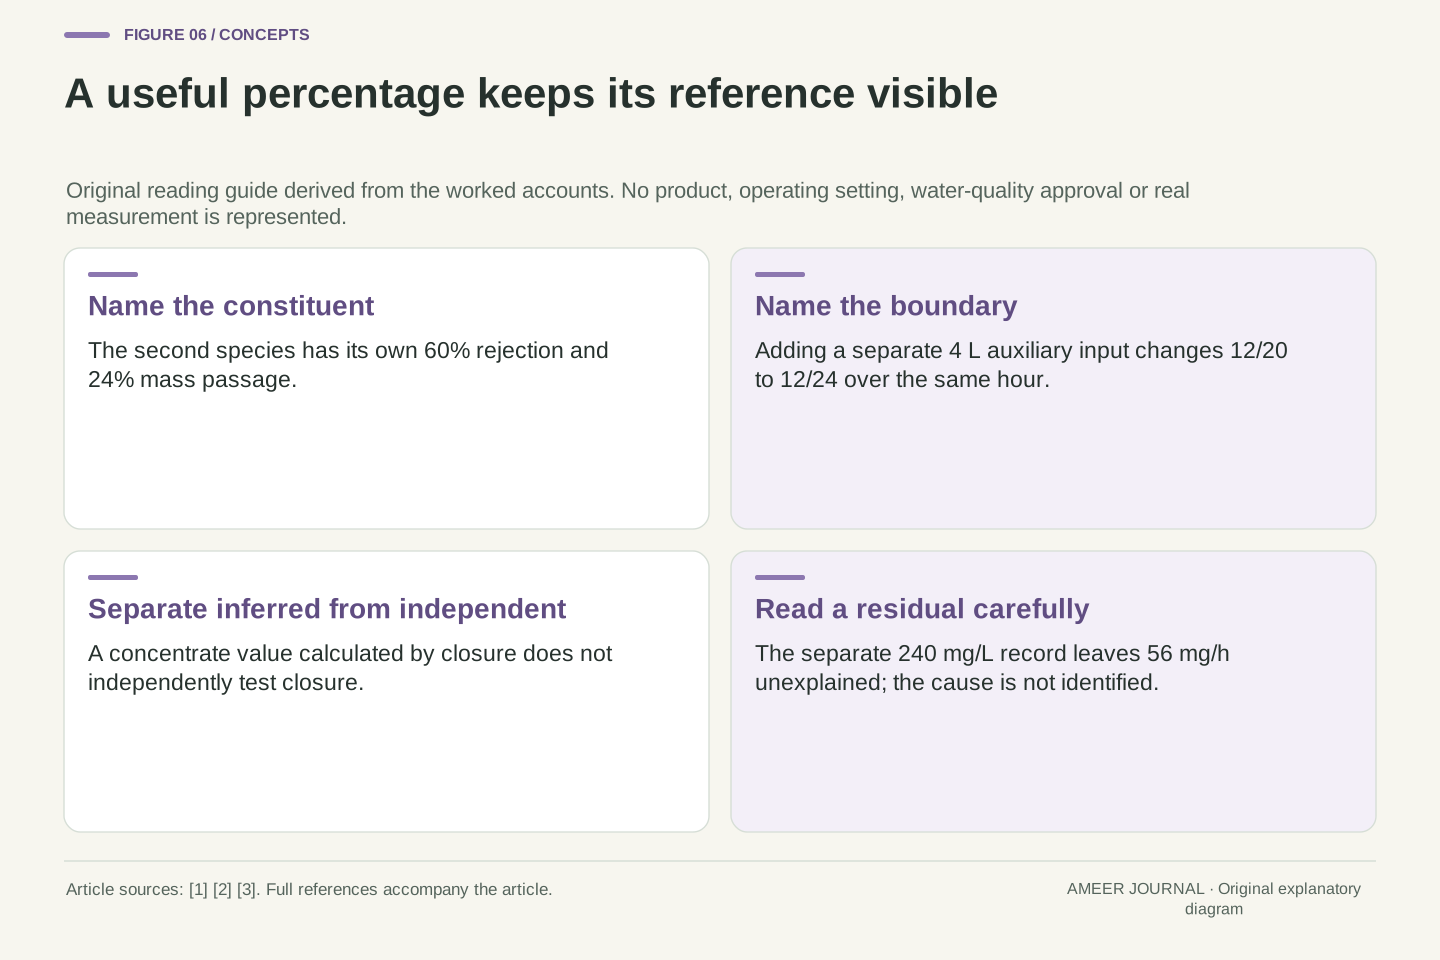
Keep the original 20, 12 and 8 litres per hour, and now track a second, separately conserved constituent B. Assign B a feed concentration of 10 milligrams per litre and a permeate concentration of 4. Its concentration rejection is 60 percent, because the concentration falls by six out of the original ten milligrams per litre.
B enters at 200 milligrams per hour and leaves in the permeate at 48 milligrams per hour. Its mass-passage fraction is therefore 24 percent. The remaining 152 milligrams per hour leave in eight litres of concentrate, giving 19 milligrams per litre. Both constituents share the water flows while having different concentration ratios.
This second record explains why a statement such as 98 percent salt rejection needs a named subject. Membrane descriptions discuss different substances and selectivity [1][2]. A result for one constituent does not supply measurements for another. Neither record tells us whether microbes or unlisted substances are present, or whether the water meets a particular intended use.
Introduce a distinct conservative species B with C_f,B=10 mg/L and C_p,B=4 mg/L, retaining the base flow split. Then R_B=1−4/10=3/5, while F_p,B=Y(1−R_B)=(3/5)(2/5)=6/25=0.24. The flow-based material rate is 48 mg/h out of 200 mg/h entering.
The concentrate carries 152 mg/h, giving C_c,B=152/8=19 mg/L. Species-specific conservation applies separately; the liquid flows are common. Assigning one species’ rejection to every constituent would introduce an unsupported equality that is absent from both the records and the general descriptions of membrane selectivity [1][2].
No total-purity metric follows merely by quoting R for the first constituent. A broader analytical measure would need its own definition and component data. Neither these balances nor a low single-species concentration establish microbial absence, regulatory compliance or suitability for drinking. The example deliberately isolates reporting semantics without proposing a contaminant limit or interpreting a real water sample.
A blend after the membrane is a new stream
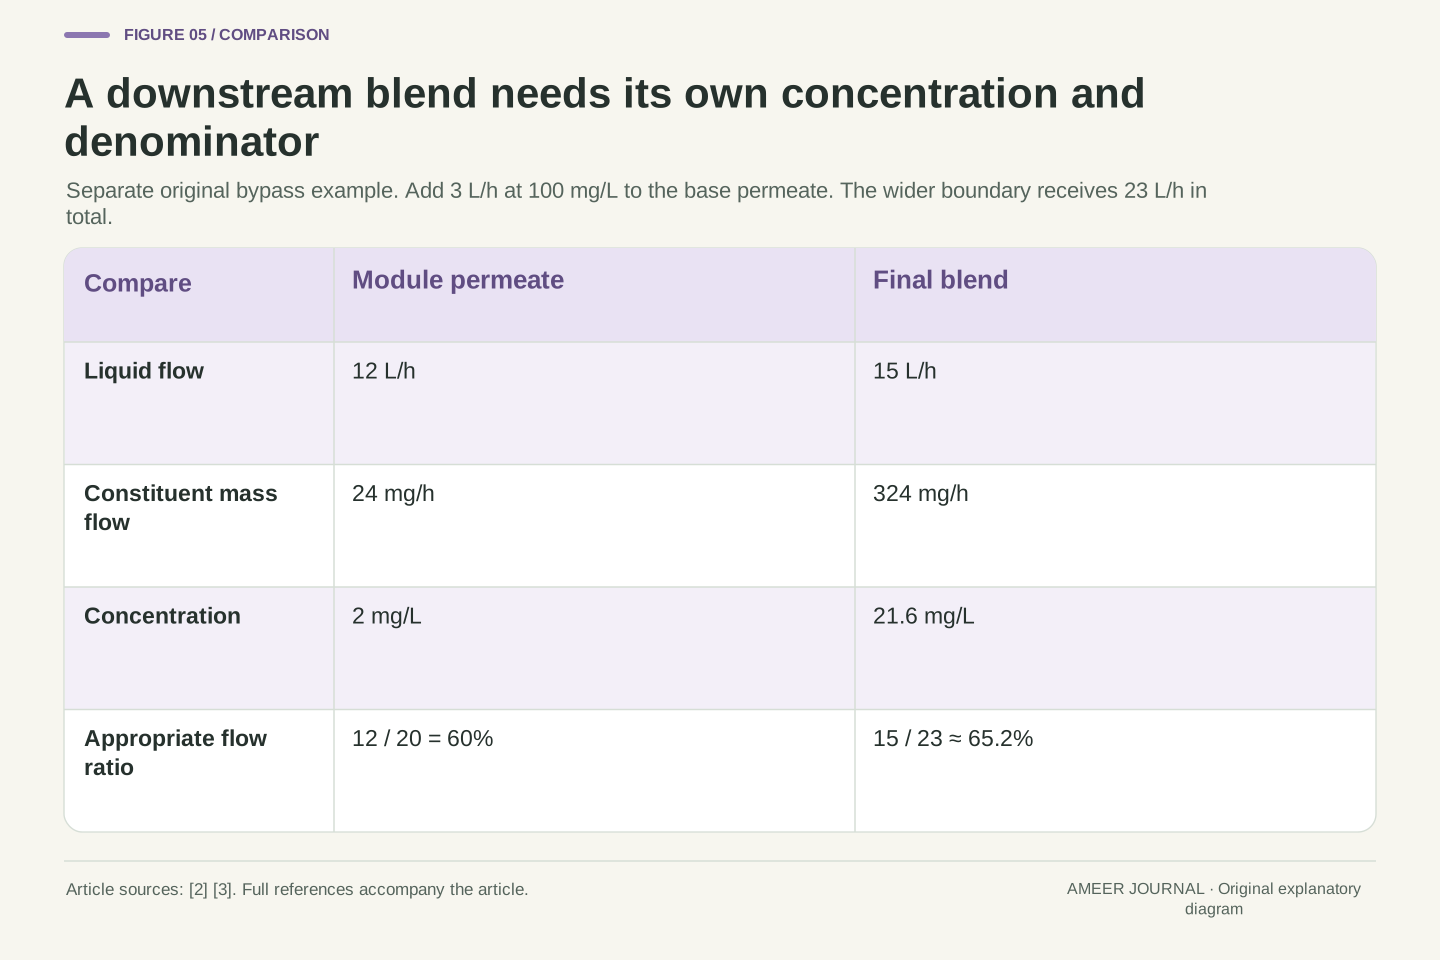
Consider a separate arrangement in which three litres per hour bypass the module at the feed concentration of 100 milligrams per litre. Mix that stream with the original twelve litres per hour of permeate at concentration 2. The blend contains 15 litres per hour and carries 300+24=324 milligrams of the constituent per hour.
Its concentration is 324÷15=21.6 milligrams per litre. The membrane’s own permeate is still at 2; the blend is not. Comparing a sample from the blend with the module’s permeate label would confuse two locations, even though both records could be internally correct.
The larger arrangement receives 23 litres per hour from outside: twenty through the module and three through the bypass. Its product-flow share is therefore 15 divided by 23, about 65.2 percent. Using 15 divided by 20 would add the bypass to the numerator while omitting it from the denominator. This is a hypothetical boundary example, not a blending recommendation.
In a separate expanded control volume, add bypass flow Q_b=3 L/h at C_b=100 mg/L. Mixing it with the unchanged base permeate gives Q_mix=15 L/h and solute rate 12·2+3·100=324 mg/h. Additive-volume, conservative mixing therefore gives C_mix=324/15=108/5=21.6 mg/L.
The external feed is now 23 L/h at 100 mg/L, rather than the module’s 20 L/h. External product fraction is Q_mix/23=15/23≈0.65217. The full balance closes: 23 L/h = 15 L/h + 8 L/h and 2,300 mg/h = 324 mg/h + 1,976 mg/h. The bypass changes the external product without altering the assigned membrane-feed or membrane-permeate records.
Consequently, a concentration comparison at the blend outlet is not the module rejection measurement. Nor is 15/20 a valid external recovery for this arrangement; it mixes boundaries. WaterSense distinguishes system water use and configuration [3], while the specific bypass values here are original arithmetic. No physical installation, permitted end use or treatment adequacy is inferred from the blend calculation.
Include auxiliary water only in the boundary it belongs to
Water purification can also involve water used for cleaning or other treatment steps [3]. To see why that matters, make a separate one-hour accounting record. The module receives 20 litres and produces 12 litres of permeate plus 8 litres of concentrate. A separate cleaning service inside the wider boundary uses another 4 litres, which leave through its own auxiliary outlet.
The module recovery is still 12 divided by 20, or 60 percent. Across the wider boundary, the product is twelve litres out of twenty-four litres entering, or 50 percent. All water is accounted for: twelve litres of product, eight of concentrate and four from the auxiliary service.
This is not a claim about how often a membrane needs cleaning or that it is being cleaned while operating. It is a reporting example with two named boundaries and one common interval. Without that distinction, one person could quote 60 percent and another 50 percent and appear to disagree while each is describing a different account.
Use a separate one-hour volume ledger with V_f,module=20 L, V_p=12 L and V_c=8 L. Add 4 L of external water used by a separate auxiliary cleaning service within a larger accounting boundary, with 4 L leaving through its auxiliary outlet. No storage change is assigned. This is not a simultaneous cleaning protocol for the operating membrane.
The module ratio remains 12/20=0.60, while the wider product-to-external-input ratio is 12/(20+4)=0.50. External closure is 24 L = 12 L + 8 L + 4 L. The additional stream’s solute concentration is unspecified, so this example closes only the liquid-volume ledger; it does not silently extend the earlier solute calculation to unknown cleaning effluent.
EPA’s guide identifies auxiliary water use and notes how off-site processes affect a facility boundary [3]. That supports distinguishing accounting scopes, not the invented four-litre quantity. A reported system ratio should retain the included services, input definition and interval. Neither ratio can replace the other unless the two boundaries and all relevant streams actually coincide.
An inconsistent balance is a question, not a diagnosis
Return to the original module, but imagine a separate record reporting concentrate concentration as 240 milligrams per litre. The two outlets would then carry 24+(8×240)=1,944 milligrams per hour. The feed still carries 2,000. There is a difference of 56 milligrams per hour, equal to 2.8 percent of the incoming amount.
That record does not fit all our original assumptions at once. It does not identify the reason. Perhaps the records describe different times, a value is inaccurate, a stream was omitted, or material was accumulating. Those possibilities would require additional information; the residual alone does not choose one.
Also distinguish a check from a rearrangement. If we infer 247 from conservation and put it back into the same equation, closure is guaranteed by construction. A separately obtained concentration could supply a real cross-check, but our article contains no actual measurement. EPA’s discussion of named feed and permeate meters illustrates why the records being compared need a clear physical location [3].
Assign a separate candidate C_c=240 mg/L while retaining the base feed and flow records. Define residual ε=Q_f C_f−Q_p C_p−Q_c C_c. Then ε=2000−24−1920=56 mg/h, or ε/(Q_f C_f)=7/250=0.028. This is an inconsistency with the stipulated zero-accumulation, conservative, complete-boundary model.
The residual is not a source-identification method. If the assumptions were relaxed, accumulation, additional streams, mismatched sampling intervals or measurement differences could affect closure. No uncertainty model is supplied, so the number is not a statistical significance result or a diagnosis of membrane failure. Choosing one explanation would require evidence beyond the three stream records.
By contrast, calculating C_c=247 mg/L from the same conservation equation makes its substituted residual zero by definition. That is useful bookkeeping but not independent validation. Keep measured or independently assigned quantities separate from inferred ones. The original example verifies internal arithmetic; it does not verify an actual water-treatment system.
Keep the three percentages together with their definitions
A complete caption for the original example can say: “For the named dissolved constituent, feed and permeate concentrations are 100 and 2 milligrams per litre, giving 98 percent concentration rejection. Feed and permeate flows are 20 and 12 litres per hour, giving 60 percent recovery. The permeate carries 24 of the incoming 2,000 milligrams per hour, or 1.2 percent of the constituent mass.” Each percentage now has its own job.
Add the concentrate result of eight litres per hour at 247 milligrams per litre, and a reader can reproduce both balances. If the outlet is instead a blend, name that location. If the denominator includes auxiliary water, list the wider boundary and interval. Those details explain a changed number more effectively than an unexplained label such as efficiency.
For a real report, the membrane, incoming water and operating conditions also matter [2][3]. The worked account has not established energy use, feasible settings or water suitability. What it supplies is a way to read a percentage precisely: identify the quantity, its reference and the streams included before deciding what the number proves.
The base record is R=49/50, Y=3/5 and F_p=Y(1−R)=3/250, with Q_c=8 L/h and C_c=247 mg/L. It simultaneously closes the assigned volume and solute balances. These quantities answer concentration, liquid allocation and constituent allocation questions, respectively; none is a complete system-performance measure.
A reproducible statement retains the constituent identity, concentration basis, units, sampling locations, common time interval and accounting assumptions. It distinguishes a derived concentrate value from an independent measurement and a membrane outlet from any downstream blend. Broader facility metrics require the external inputs and auxiliary streams belonging to their chosen boundary.
Source descriptions identify real dependence on membrane, feed and configuration [2][3], but those dependencies are not computed by this mass balance. The original example supplies neither an energy model nor treatment-quality verification. Its contribution is a transparent mapping from declared records to three different ratios. When a number changes, that mapping lets a reader check whether the constituent, flow, sampling point or denominator changed before attributing the difference to the membrane itself.
Sources & further reading
Explore the references behind this guide. External pages may change after our review.
- Overview of Drinking Water Treatment Technologies | US EPAU.S. Environmental Protection Agency · Accessed 7 Nov 2026
- Reverse Osmosis (RO)DuPont Water Solutions · Accessed 7 Nov 2026
- WaterSense at Work, Section 7.1: Water Purification (March 2024)U.S. Environmental Protection Agency, Office of Water · Accessed 7 Nov 2026
Article updated 7 Nov 2026.
Found something we should revisit?
Good explanations get better with thoughtful feedback.