What you’ll take away
- A wheel encoder measures rotation; ground travel also depends on the conversion and rolling assumptions.
- A shortfall percentage needs a named reference distance and a valid denominator.
- A small endpoint error can coexist with a much larger error in total path length.
- An unavailable motion estimate is different from an estimate of zero movement.
- Correct relative motion can still retain an incorrect starting map position.
The wheel can complete its turn without completing the expected journey
A rover’s wheel sensor can count ten turns correctly while the rover moves less far than those turns suggest. The sensor has reported rotation; the software still needs a rule connecting rotation to movement over the ground. That connection changes when a wheel slips. JPL describes rover navigation using measured wheel rotation alongside other information, including camera-based estimates of motion [1]. ESA’s ground-test report makes the reason clear: checking progress with images can account for slip that a wheel-turn count alone misses [3].
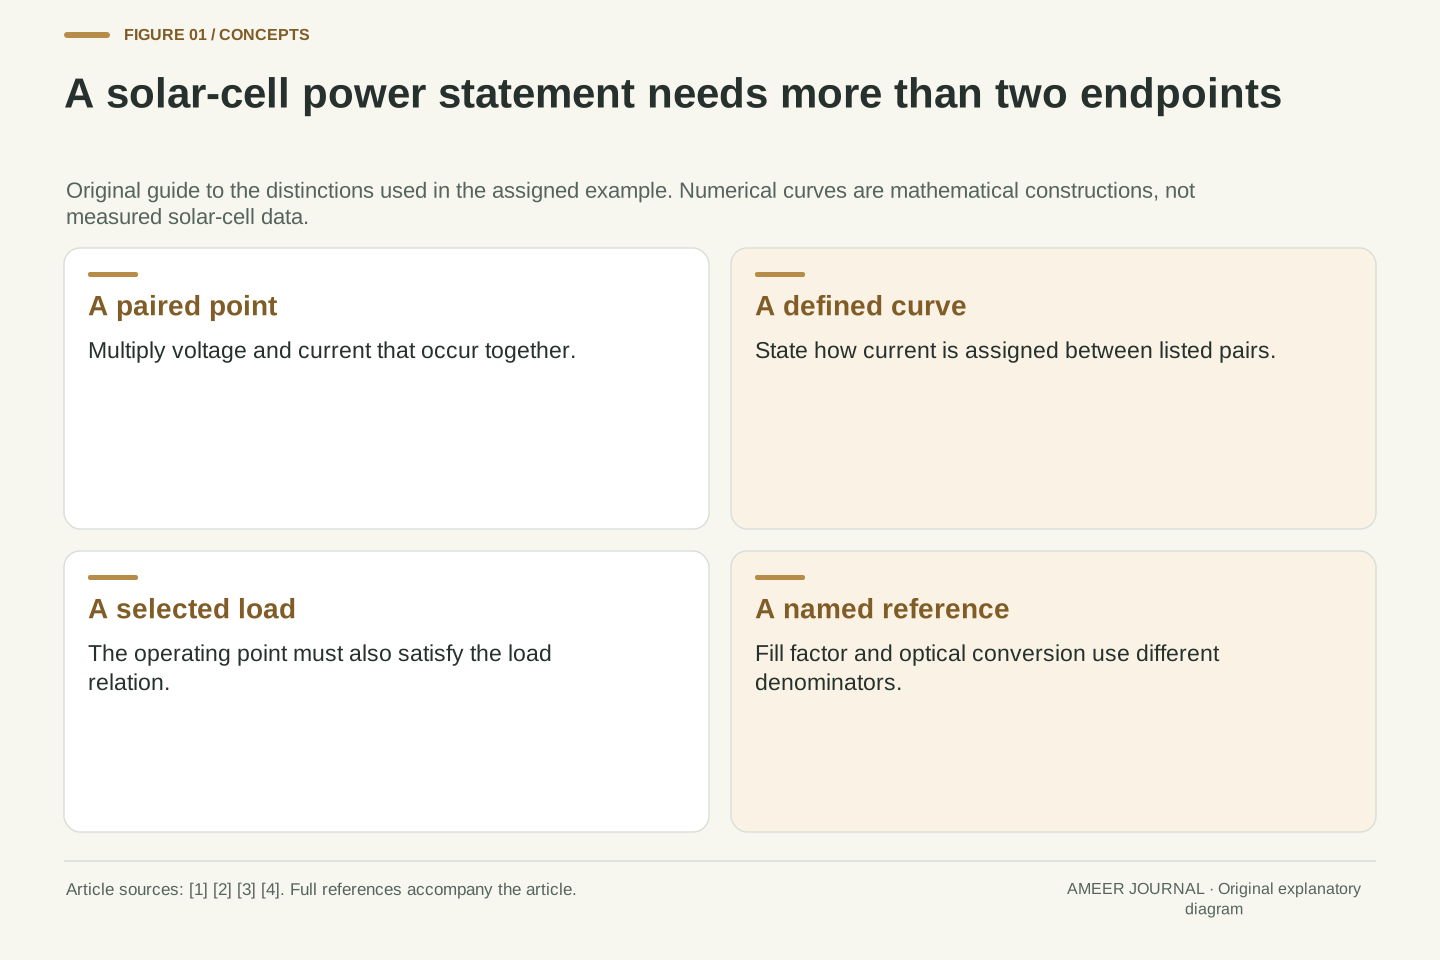
Follow an invented rover along a straight line on level ground. Its conversion assumes half a metre of travel per wheel revolution, and its rotation readings are exact. We will first give it ten forward revolutions, then examine a separate forward-and-reverse trip. All ground distances, image-based estimates and uncertainty bounds in these examples are supplied numbers, not measurements from Mars. The question is what each record can establish. An accurate wheel count, an estimated distance and a map position are connected pieces of information, but each needs its own assumptions.
Wheel odometry converts measured rotation into a motion estimate through a kinematic model. Accuracy of the rotation measurement does not establish validity of the no-slip conversion. The historical NASA Tech Brief explicitly distinguishes a no-slip full-vehicle kinematic estimate from a visual/inertial estimate used for comparison [2]. JPL likewise describes wheel and attitude inputs alongside feature-based visual odometry [1]. These sources motivate separating the observation from the model that translates it into ground motion.
Our original construction is one-dimensional, with a fixed coordinate axis, straight level travel, no steering or lateral motion and an assigned no-slip distance per revolution c=0.5 m. Encoder values are exact. Ground movements are stipulated separately, allowing us to test identifiability and arithmetic without running a rover, image matcher or simulator. This scalar example is not a six-wheel flight-software model. Its slip definition, introduced below, belongs to the declared interval and denominator; it is not attributed as the complete slip metric used by any mission.
Write down the conversion before trusting the distance
An encoder records how much a wheel turns. In our example, one complete revolution corresponds to half a metre in the no-slip conversion. Two revolutions predict one metre, and ten predict five metres. Multiplying the turns by the distance per turn gives the wheel-based travel estimate. It does not separately check whether the ground interaction allowed that travel. The historical NASA description identifies the no-slip assumption inside a rover’s kinematic estimate [2], rather than treating wheel rotation as a direct measurement of every part of the vehicle’s motion.
Choose forward as the positive direction along our line. A forward turn contributes plus half a metre to the prediction, while a reverse turn contributes minus half a metre. Keeping that sign will matter when the rover returns toward its starting point. Real rover geometry can also involve steering, suspension and orientation; the NASA brief lists several such inputs [2]. We leave them fixed here to isolate one issue. Even this simple multiplication needs both a conversion factor and a direction before it becomes a statement about position.
Let n be signed wheel revolutions during an interval and c the assigned no-slip travel per revolution. The scalar prediction is Δx_w=cn. With c=1/2 m, n=10 gives Δx_w=5 m. The measured quantity is n; multiplying by c supplies a model-dependent displacement. For positive monotonic travel, its magnitude is also the predicted path length. The distinction follows the source’s explicit separation between wheel-based kinematics and independently estimated motion [2].
The coordinate convention stays fixed throughout the article: forward is positive and reversing changes the sign of n, not the orientation of the coordinate axis. No turn-in-place or curved trajectory is included. Full rover kinematics may use wheel rates, steering angles and suspension geometry, as described in the historical brief [2]. Consequently, this one-dimensional equation should not be substituted for that complete system. It is sufficient for the current inference question because even exact signed rotation and a simple geometry leave the wheel-to-ground relationship unobserved.
The same ten turns fit three different movement stories
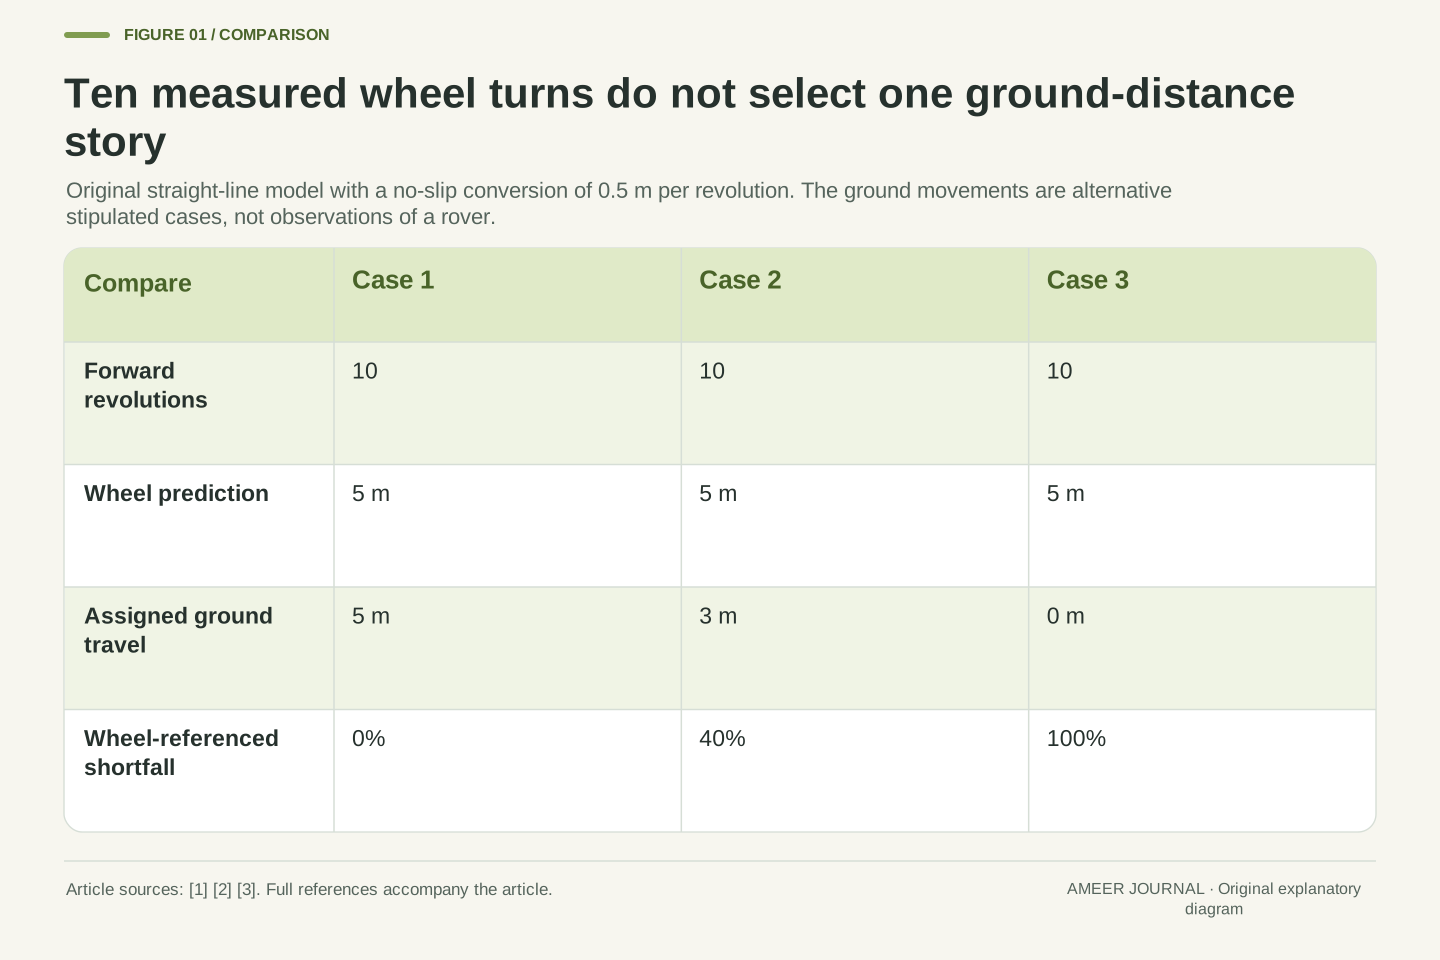
Keep the ten forward revolutions and the five-metre wheel prediction. In one possible story, the rover really advances five metres. In a second, it advances only three metres. In a third, the wheels turn while the rover makes no forward progress. All three stories contain the same encoder record. We supplied different ground movements because the wheel count by itself does not tell us which story happened. ESA’s discussion of wheel slip is the practical motivation for checking progress with a separate view of the terrain [3].
For the rest of the first example, choose the three-metre story. The wheel prediction overstates ground travel by two metres. Nothing in that result requires the encoder to have missed a turn or added a false one. The error enters when rotation is interpreted through a no-slip model that does not describe the assigned ground movement. This is a useful distinction when reading a rover log: a trustworthy sensor value can feed an unsuitable conversion. Improving the precision of the same rotation count alone would not identify the missing ground-distance information.
Hold the observable n=10 and the assumed c=0.5 m fixed. The wheel-only model predicts 5 m. Consider three stipulated ground displacements Δx_g∈{5,3,0} m. They are alternative physical-motion assignments to the same rotation observation, not repeated measurements or probabilistic outcomes. If slip is unconstrained, the encoder record cannot select among them. The comparison between wheel-based kinematics and visual motion in the source provides the relevant measurement distinction [2][3].
Selecting Δx_g=3 m gives prediction error Δx_w−Δx_g=2 m. This is a model mismatch under exact rotation data. Reducing encoder quantization would not, by itself, distinguish the three assigned ground trajectories, because their encoder inputs are already identical. An additional ground-referenced estimate or a justified rolling constraint is needed. This is an identifiability statement for the construction, not a claim that every real encoder error is negligible or that wheel odometry is useless; it identifies which missing relationship the selected observation does not determine.
Forty percent and sixty-seven percent can describe the same difference
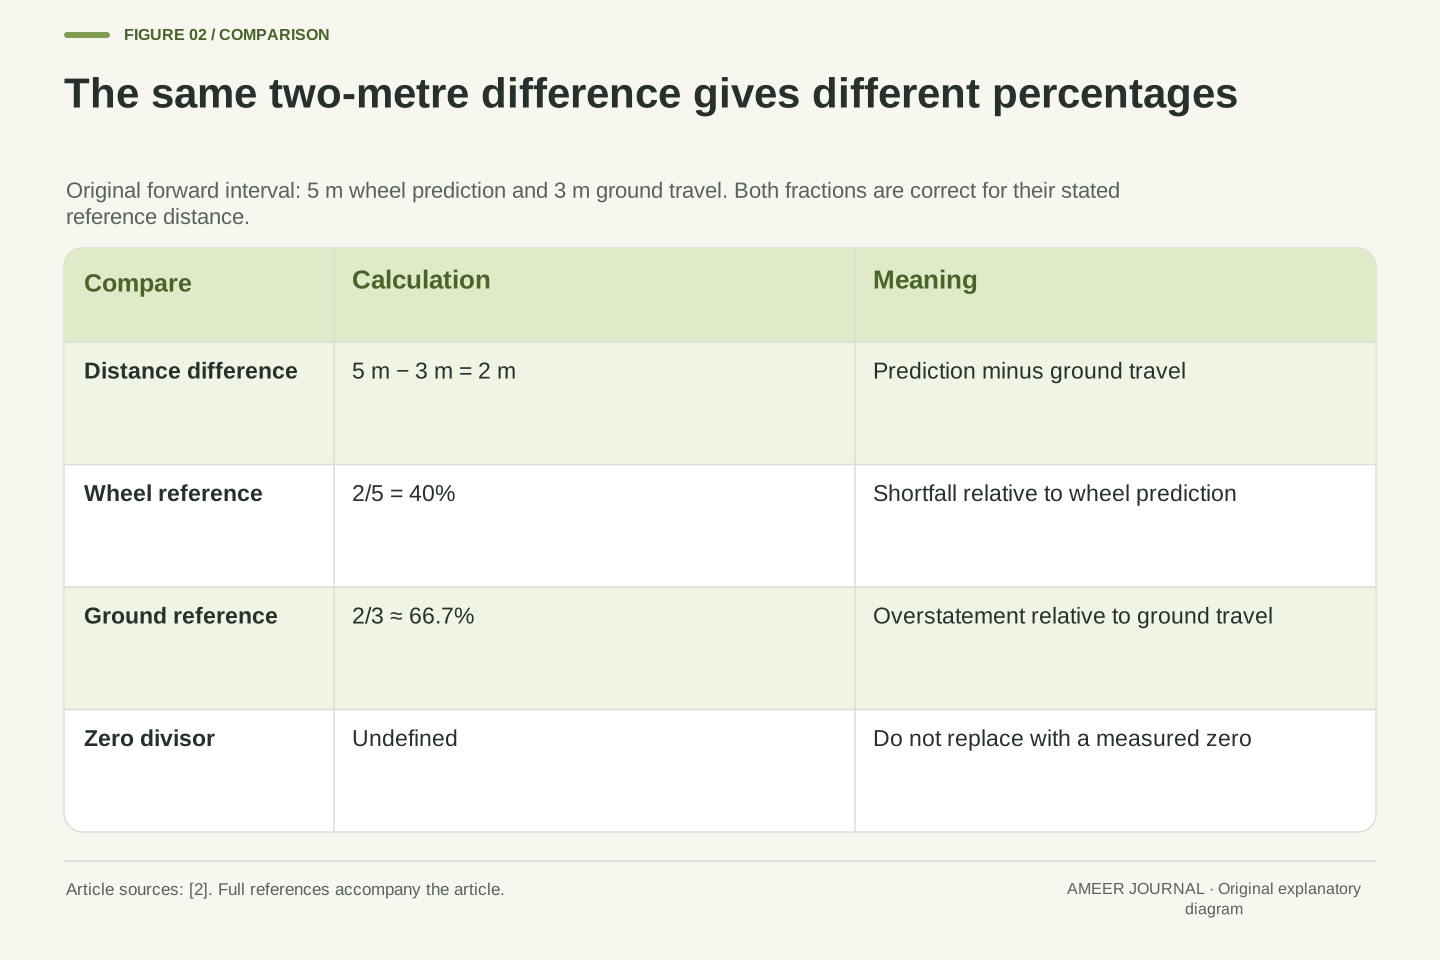
Define a fraction for this forward-only example: subtract ground travel from wheel-predicted travel, then divide by wheel-predicted travel. Five metres predicted and three metres travelled gives two divided by five, or 40 percent. We will call this the wheel-referenced shortfall. Zero means the two distances agree; 100 percent would mean positive predicted travel with no forward progress. This definition is ours for the stated straight-line case. It should not be confused with the more complete comparisons used in a real rover navigation system [2].
Someone could describe the very same two-metre difference relative to the three metres actually travelled. Two divided by three is about 66.7 percent, so the prediction is about 66.7 percent larger than ground travel. That does not contradict the 40 percent result: the denominator changed. Always ask which distance supplies the reference. Our first fraction also requires positive wheel-predicted travel. If the recorded wheel travel were zero, dividing by it would be undefined, and a new measurement definition would be needed rather than a convenient zero slipped into the calculation.
Define s=(d_w−d_g)/d_w=1−d_g/d_w for d_w>0 and 0≤d_g≤d_w in a monotonic forward interval. This bounded scalar shortfall gives s=2/5=0.4 for d_w=5 m and d_g=3 m. The limiting assignments d_g=d_w and d_g=0 give s=0 and s=1 respectively. The bound 0≤s≤1 follows from the chosen domain, rather than being an asserted bound for every possible slip convention. It is an explicitly declared teaching metric; the source’s full vehicle comparison incorporates richer kinematics and motion estimates [2].
Relative overstatement against ground travel instead uses (d_w−d_g)/d_g=2/3≈0.6667 when d_g>0. The numerator is unchanged, but the reference quantity differs. Neither fraction should be presented without its denominator and interval. The wheel-referenced expression is undefined at d_w=0, while the ground-referenced expression is undefined at d_g=0. Sideways motion, arbitrary signed displacement and turning require their own definitions. These restrictions prevent the simple forward formula from silently becoming a universal mission diagnostic or an arithmetic rule for every possible rover maneuver.
A small endpoint error can hide a much larger travel error
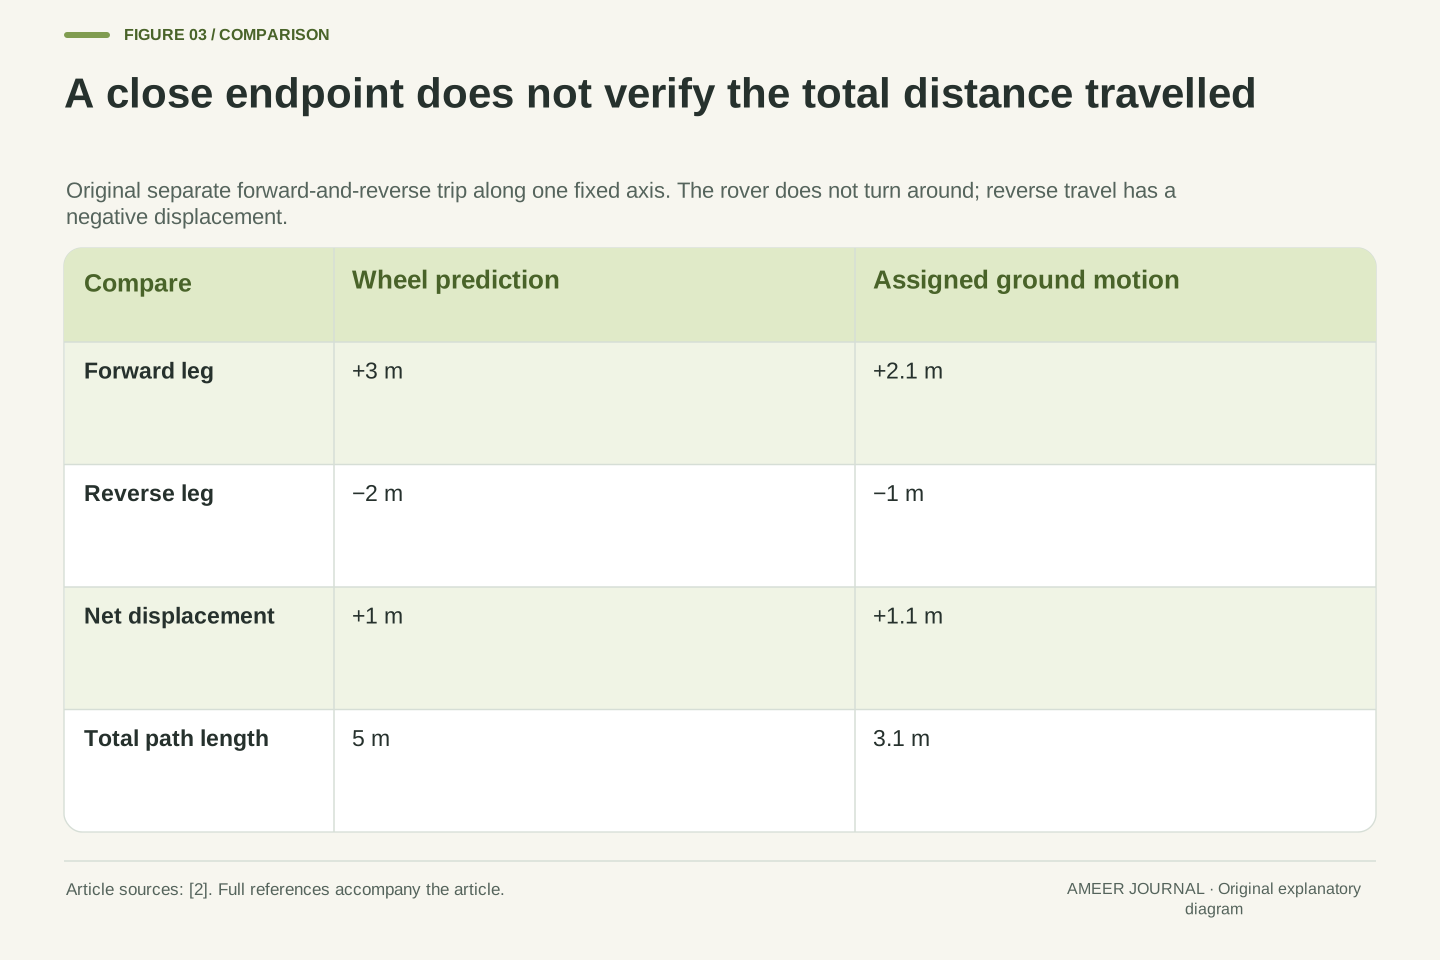
Start a separate trip at position zero. The wheels make six forward revolutions, predicting three metres, while the assigned ground movement is 2.1 metres forward. They then make four reverse revolutions, predicting two metres backward, while the assigned movement is one metre backward. The rover does not turn around; it moves backward along the same line. The wheel-based final position is three minus two, or one metre. The assigned final position is 2.1 minus one, or 1.1 metres. The two endpoints are only 0.1 metre apart.
Now count the total distance travelled, including the return portion as positive distance. The wheel record predicts three plus two, or five metres of path. The assigned ground path is 2.1 plus one, or 3.1 metres. The difference is 1.9 metres, much larger than the endpoint difference. Returning partly cancels signed displacement; it does not erase distance already travelled. A rover report therefore needs to distinguish where the vehicle ended from how much path it covered. A close endpoint agreement alone cannot verify every movement along the route.
For a separate two-leg trajectory, use signed revolutions n=(6,−4). The wheel-based displacement vector is (3,−2) m, while stipulated ground increments are (2.1,−1) m. Summing signed increments gives Δx_w,net=1 m and Δx_g,net=1.1 m. The signed endpoint-estimate error is −0.1 m. Reversal changes travel direction while preserving the fixed coordinate convention and straight-line geometry. The wheel and ground arrays refer to matching interval boundaries; no unsigned path distance has been substituted for a signed increment.
Summing magnitudes instead gives wheel-predicted path L_w=|3|+|−2|=5 m and ground path L_g=|2.1|+|−1|=3.1 m. The path-length overestimate is 1.9 m. Signed cancellation explains why a small final-position discrepancy can coexist with substantial path error. Both legs have less ground travel than their no-slip magnitude predicts, yet the predicted final position lies behind the assigned endpoint. No contradiction arises: an endpoint difference and a sum of traveled magnitudes are different functionals of the same sequence.
Combine segment fractions using the distances they describe
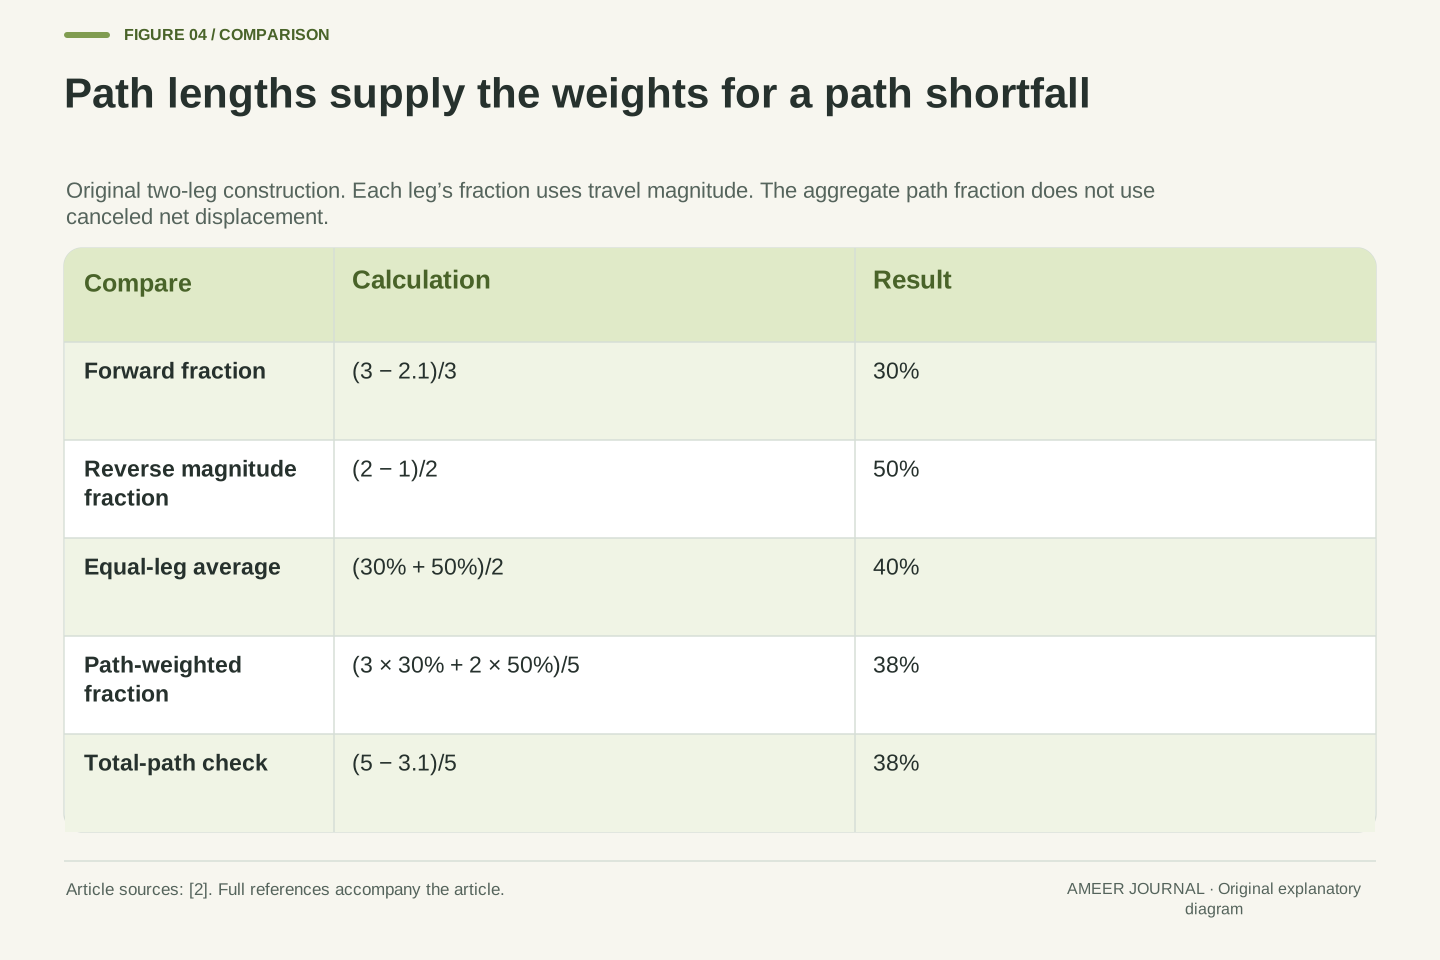
The forward leg falls short by 0.9 metre out of three predicted metres, or 30 percent. The reverse leg falls short in travel magnitude by one metre out of two, or 50 percent. To describe the whole path, add the shortfalls and divide by the total predicted path: 1.9 divided by five is 38 percent. Averaging 30 and 50 directly would give 40 percent. That equal average treats both legs as equally important even though one contains three predicted metres and the other contains two.
The path calculation instead gives the longer predicted leg more weight. Three times 30 percent plus two times 50 percent, divided by five, again gives 38 percent. Do not replace those path lengths with the one-metre net wheel displacement: that number has already canceled forward and reverse travel. Using the signed endpoint difference would produce a negative 10 percent quotient, which answers a different algebraic question. These original calculations explain why a slip-related percentage needs both a clearly named distance and a rule for combining segments.
Apply the forward-style shortfall to the magnitude of each monotonic leg. The values are s₁=(3−2.1)/3=0.3 and s₂=(2−1)/2=0.5. Define aggregate path shortfall S=(L_w−L_g)/L_w. Then S=(0.9+1)/(3+2)=1.9/5=19/50=0.38. This equals the predicted-path-weighted mean (3s₁+2s₂)/5, rather than the equal-leg mean (s₁+s₂)/2=0.4. The two deficit contributions are 0.9 m and 1 m; retaining these distances before division prevents a hidden change of weights.
The appropriate weights arise from the denominator of the aggregate definition. They do not depend on which leg occurs first, but they do depend on retaining its magnitude. In contrast, (Δx_w,net−Δx_g,net)/Δx_w,net=(1−1.1)/1=−0.1 uses canceled endpoint quantities. It is not S and should not be interpreted as the path shortfall. These are exact properties of our two-leg record. They do not establish a general slip formula for lateral motion, changing wheel geometry or a full three-dimensional vehicle pose.
Images add another estimate of movement
Visual odometry examines terrain features in images taken at different points in a drive. JPL describes tracking features between stereo-image pairs to estimate the rover’s position and orientation change [1]. The historical NASA brief describes combining visual and inertial information before comparing it with the wheel-based estimate [2]. This adds evidence about movement relative to the surroundings. It does not require us to pretend the wheel counter was broken, and it does not make camera-based position automatically exact.
A feature moving across an image is also not, by itself, a distance measured in metres on the ground. The camera can translate or change its orientation, and image coordinates need a geometric interpretation. The cited rover systems estimate motion using their camera and vehicle information. In our paper example, we supply the ground-distance estimate directly so that its consequences remain inspectable. We have no image pair, calibration record or feature-matching result from which to claim actual accuracy. The useful change is that the distance estimate now has a source beyond wheel rotation alone.
JPL describes visual odometry as terrain-feature tracking between stereo-image pairs, producing a six-degree-of-freedom pose estimate [1]. The historical Tech Brief describes feature-based relative motion estimation and a visual/inertial estimate compared with no-slip vehicle kinematics [2]. This supplies a second evidential route to motion; it is not merely a more finely rounded version of the same wheel count. The complete estimator and its assumptions remain separate from the scalar arithmetic used here.
Image displacement has image-coordinate units and can reflect translation and orientation change. Converting feature observations to metric motion requires the relevant geometric model, not a direct relabelling of pixels as metres. We do not reconstruct that pipeline or claim a successful visual update. Instead, the following case stipulates a motion estimate with an explicit bound. This keeps the role of visual evidence clear while leaving calibration, correspondence quality and estimator validation as requirements of any actual implementation, rather than unmeasured achievements of the current example.
An uncertain movement estimate gives an uncertain shortfall
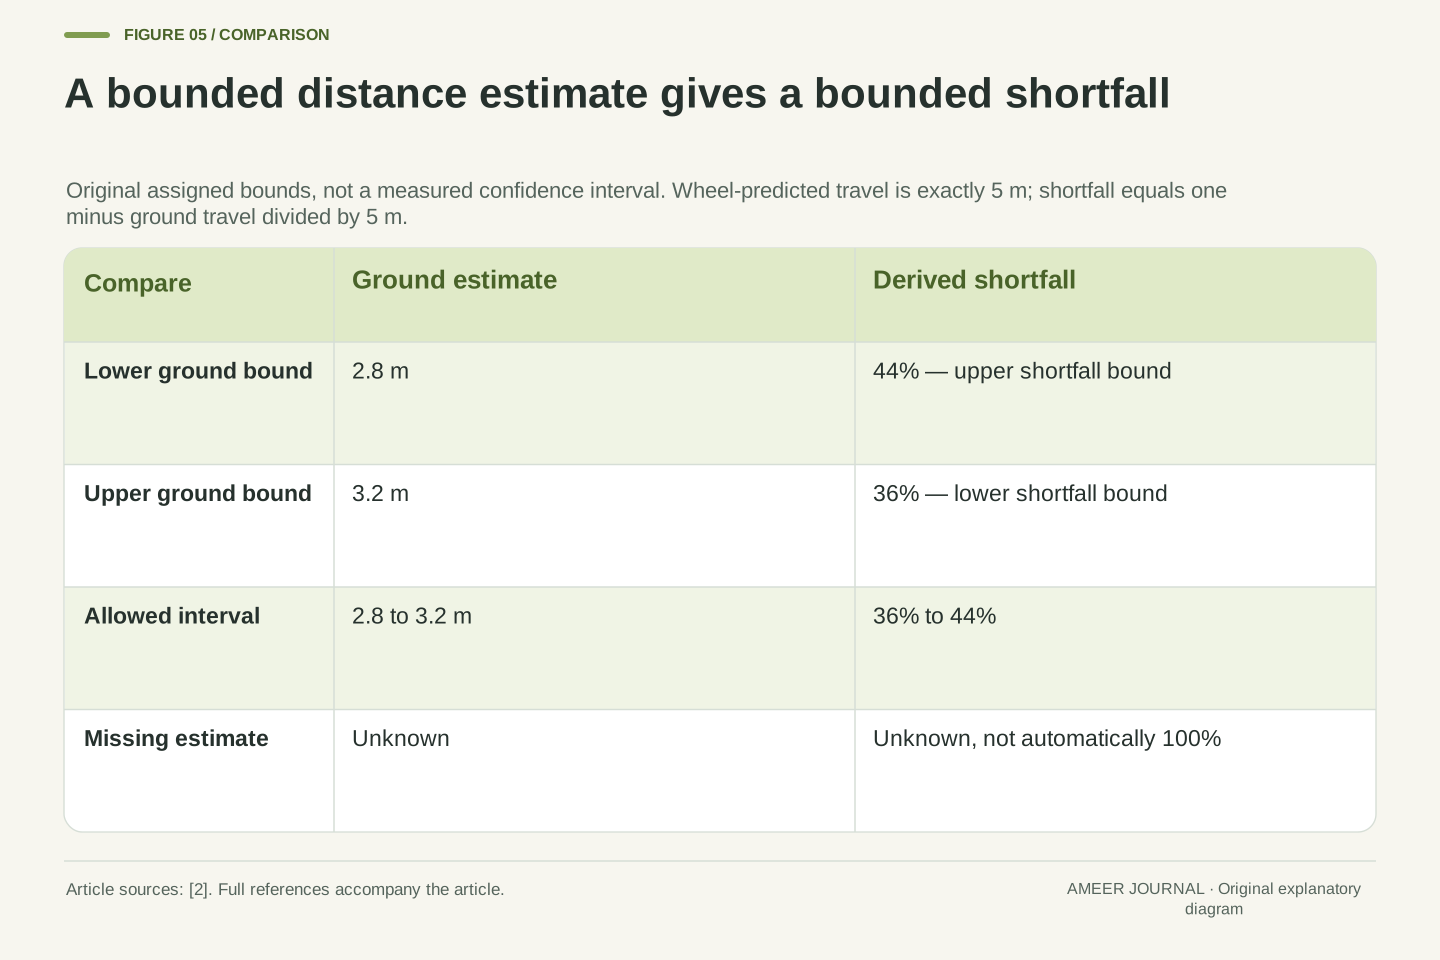
Return to the ten-turn interval with five metres of wheel-predicted travel. Suppose a separate estimate says the ground movement lies between 2.8 and 3.2 metres. Treat that range as an assigned bound for this exercise. The largest ground movement gives the smallest shortfall: one minus 3.2 divided by five equals 36 percent. The smallest ground movement gives the largest shortfall: one minus 2.8 divided by five equals 44 percent. The result is a range from 36 to 44 percent, not a single exact 40 percent.
If a fictional question asks whether the shortfall exceeds 40 percent, this range does not settle the answer. It contains values on both sides of 40. The range is not a measured confidence interval, and the threshold is not a recommended rover setting. If the separate estimate is missing altogether, there is even less information. Missing distance is not evidence that the rover moved zero metres; assigning zero would falsely produce 100 percent shortfall. Keep an unavailable estimate distinct from an available estimate whose value actually is zero.
With exact d_w=5 m and a stipulated deterministic bound d_g∈[2.8,3.2] m, the monotone decreasing mapping s=1−d_g/5 gives s∈[1−3.2/5,1−2.8/5]=[0.36,0.44]. Reversing the endpoint order is necessary because larger ground progress produces smaller shortfall. This is interval propagation through the declared formula, not a confidence level, fitted uncertainty distribution or empirically established rover accuracy. Exact wheel-predicted distance was a premise; uncertainty in its conversion would require another bound or model.
The hypothetical predicate s>0.4 is undecided by that bound because admissible values occur on both sides. Choosing the midpoint would not remove the uncertainty. An absent reference estimate is a different state again: it does not imply d_g=0, and the corresponding s remains unknown. This matters when interpreting a comparison between estimates, such as the one described in the historical brief [2]. A missing update, a reported zero motion and a bounded nonzero displacement must retain distinct meanings before any derived fraction is calculated.
Small repeated errors can remain after a large slip correction
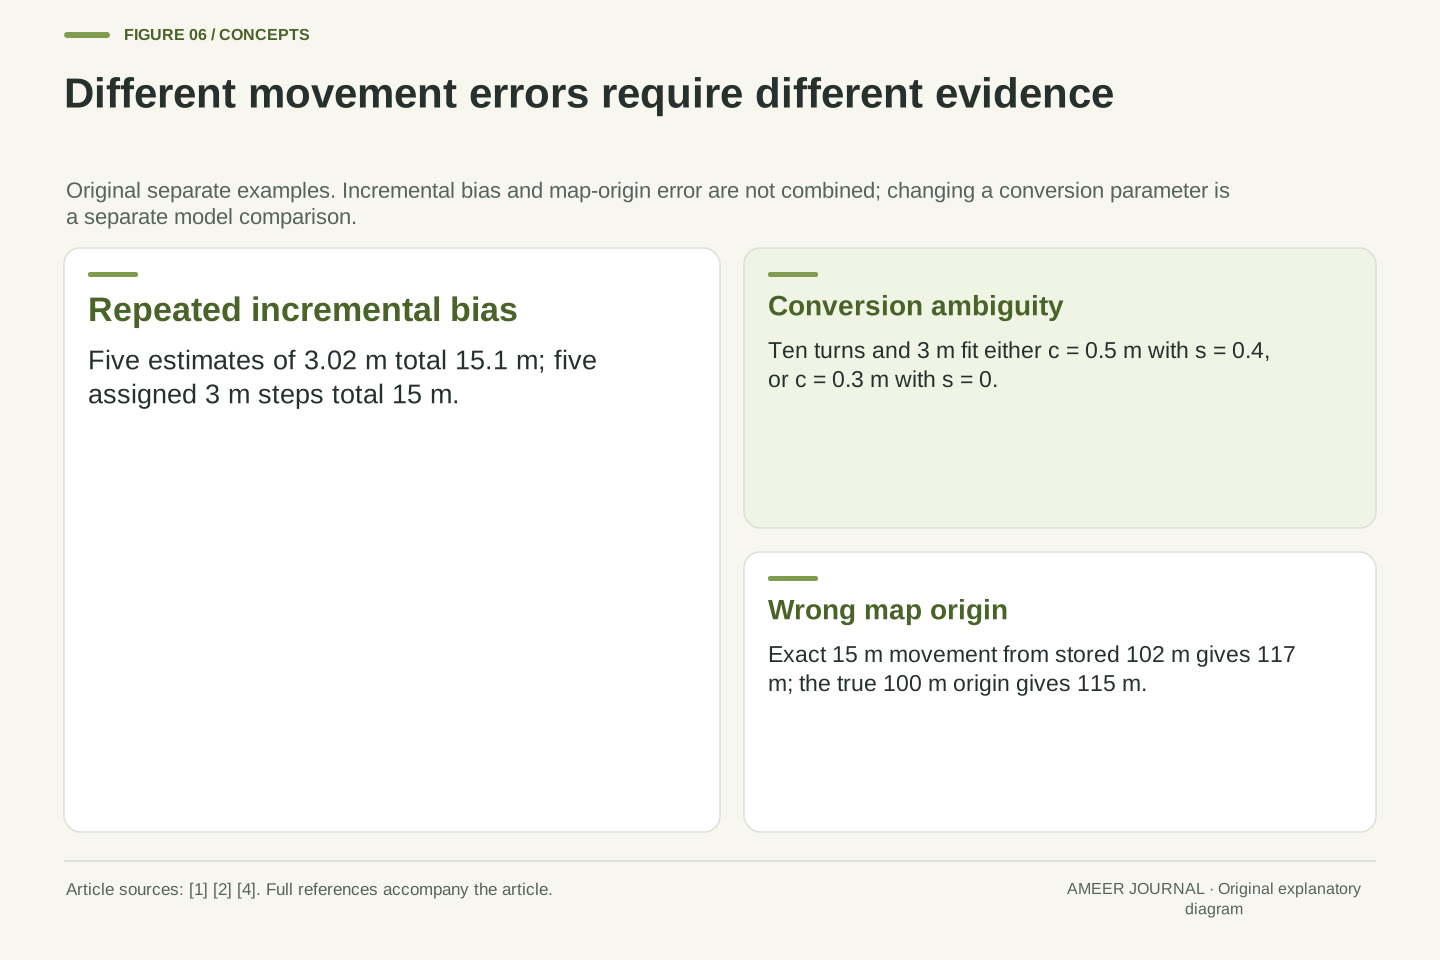
Imagine five consecutive forward steps. For each step, the wheel record predicts five metres and the assigned ground movement is three metres. The wheel-only total becomes 25 metres, while the assigned ground total is fifteen. Now suppose a separate motion estimate reports 3.02 metres on every step. Its accumulated result is 15.10 metres, only 0.10 metre above the assigned total. This estimate is much closer in our construction, but it still carries a small error in the same direction on every step.
The repeated two-centimetre error adds; it does not cancel just because five steps were recorded. We deliberately chose a consistent bias, so a random-error cancellation argument would not describe these values. NASA’s February 2026 report explains that incremental visual-odometry errors can accumulate over a drive [4]. Our numbers illustrate that principle without borrowing the mission’s performance figures. Correcting a large wheel-based mismatch and knowing an exact position are different achievements, and an improved estimate should keep its remaining limitations visible.
For five original monotonic steps, set each wheel prediction to 5 m and each ground increment to 3 m. Their totals are 25 m and 15 m, giving a 10 m wheel-only endpoint error. Assign an alternative incremental estimate of 3.02 m per step. Its total is 15.1 m and its error is 0.1 m. The per-step error is a coherent +0.02 m bias, not an independent zero-mean random variable. These are fixed assigned values, so the result can be checked by summing the five increments directly.
Because the errors are identical in sign and magnitude, the sum is exactly 5×0.02=0.1 m. No square-root-of-count reduction or confidence statement follows. NASA’s dated localization report describes the broader problem of accumulating visual-odometry error [4]; the present magnitudes are entirely invented. This construction separates two claims: the alternative estimate substantially improves the assigned wheel prediction, yet it does not equal ground truth. A useful account of localization retains both conclusions instead of turning a correction mechanism into an unconditional accuracy guarantee.
A wrong distance-per-turn assumption can resemble slip
So far we treated half a metre per revolution as known. Relax that assumption and return to ten recorded turns with three metres of known ground travel. One explanation is our original half-metre conversion with a 40 percent shortfall. Another mathematical explanation is a distance-per-turn conversion of 0.3 metre with no shortfall at all. Both give three metres from the same ten turns. These are alternative parameter choices, not a story in which the physical wheel suddenly changes size during the drive.
The comparison shows why a mismatch cannot be assigned to slip alone if the conversion factor is also uncertain. You would need evidence about that factor, the ground-motion estimate and whether the two records describe the same interval. The NASA brief’s wheel prediction is explicitly based on a vehicle model [2]; a model input is part of what must be justified. Our earlier 40 percent result remains correct under its stated half-metre assumption. What changes here is the information allowed to vary, which creates a second explanation for the same observations.
Write the assigned ground progress as d_g=cn(1−s) for the restricted forward model. With n=10 and d_g=3 m, the parameter pairs (c=0.5 m,s=0.4) and (c=0.3 m,s=0) both satisfy the equation. Rotation and ground progress alone identify their product c(1−s)=0.3 m, not both parameters separately. The main example fixed c; this alternative deliberately removes that information. Substituting either displayed pair gives the same 3 m result, even though its explanation differs.
The ambiguity concerns conversion assumptions, not a measured deformation process or a claim about a particular rover wheel. A real disagreement could also require checking the validity and timing of the comparison estimate. The source’s distinction between modeled vehicle kinematics and a visual/inertial estimate is relevant here [2], but our two-pair algebra is original. It demonstrates why an inferred slip value should carry the calibration and interval conditions on which it depends. A precise displayed fraction cannot establish that those conditions were themselves correct.
Relative movement still needs a starting point on the map
Consider a separate case where the relative movement is exactly fifteen metres forward. If the true starting map coordinate is 100 metres, the true final coordinate is 115. If the stored starting coordinate is instead 102, adding the same correct fifteen metres gives 117. The initial two-metre map error remains. This case has no per-step error; it isolates the starting reference. Knowing how far the rover moved does not independently establish where that movement began on a larger map.
NASA’s February 2026 report describes comparing rover panoramas with orbital terrain imagery to obtain a map-based location [4]. That supplies a different reference from chaining together local movement estimates. The distinction is between estimating a change and locating the result in a wider coordinate system. It does not mean any image match is exact or that all missions use the same method. Our straight-line arithmetic shows why an external reference can answer a question that even perfect relative odometry leaves open: which map position belongs to the current rover pose?
In a separate fixed-axis construction, let the exact relative displacement be Δx=15 m. The true initial map coordinate x₀=100 m gives x_f=115 m. A stored initial coordinate of 102 m instead produces x̂_f=117 m. The two-metre initial offset persists even though Δx is exact. This case is intentionally independent of the preceding 0.02 m per-step bias and should not have that bias added to it. It isolates the reference offset while holding the relative movement correct in both calculations.
Relative pose increments need an initial pose and frame relationship to become a global map estimate. NASA’s February 2026 article describes matching navigation-camera panoramas against orbital terrain maps as an additional localization reference [4]. We cite that reported mechanism, not its numerical accuracy or current operating status. External matching has its own evidence requirements and uncertainties; it is not a mathematical guarantee of exact location. The example establishes only that local-motion correctness and map-origin correctness are separate conditions, so improving one does not automatically repair the other.
Keep observations, conversions and reference estimates visible
A useful motion log would let a reader follow the chain: wheel turns, the distance-per-turn conversion, the direction, the predicted movement and any separate estimate of ground movement. It would state which interval each value covers and whether an estimate is valid, bounded or unavailable. For a return trip, it would keep signed position change separate from total path. Those distinctions explain every apparent disagreement in our examples, including 40 versus 66.7 percent and a small endpoint error beside a much larger path error.
Planning a route is another related job. ESA’s historical test report describes building a local terrain map and choosing a path, then checking progress as the rover moves [3]. A chosen destination does not prove the vehicle reached it, just as a counted turn does not prove its expected ground travel occurred. Wheel sensing, motion estimation and map localization each contribute useful information. The clearest explanation keeps their roles connected while preserving the assumptions between them, so a precise sensor reading does not become a stronger claim than the evidence supports.
A reproducible record preserves signed rotation, the conversion model, interval boundaries, coordinate frame, predicted increment and comparison-estimate validity. Derived quantities should name their denominator and aggregation weights. In these fixtures, the same record supports distinct values for endpoint displacement, path length, wheel-referenced shortfall and ground-referenced overstatement. Replacing any of these with an unlabeled distance or percentage loses the conditions needed to reconstruct the result.
The planning and localization roles also remain distinct. ESA’s ground-test report discusses choosing a path from local terrain information and separately tracking onward progress [3]. JPL and the historical NASA brief describe complementary observations for estimating actual motion [1][2]. Our examples show why this separation matters without prescribing a flight-control system: exact wheel counts can coexist with slip, bounded motion estimates propagate into bounded fractions, coherent errors can accumulate, and a correct relative change can retain a wrong map origin. Every conclusion follows from a named observation or explicitly supplied model assumption.
Sources & further reading
Explore the references behind this guide. External pages may change after our review.
- Surface System Software and Rover NavigationNASA Jet Propulsion Laboratory / Caltech · Accessed 7 Nov 2026
- Path Following with Slip Compensation for a Mars RoverNASA Technical Reports Server / Jet Propulsion Laboratory · Accessed 7 Nov 2026
- ExoMars software passes ESA Mars Yard driving testEuropean Space Agency · Accessed 7 Nov 2026
- NASA’s Perseverance Now Autonomously Pinpoints Its Location on MarsNASA / Jet Propulsion Laboratory · Accessed 7 Nov 2026
Article updated 7 Nov 2026.
Found something we should revisit?
Good explanations get better with thoughtful feedback.