What you’ll take away
- A screen can produce magenta by combining spectral contributions; it does not average their wavelengths into a new magenta wave.
- Wavelength and frequency describe a physical component, while a spectrum describes how contributions vary across wavelengths.
- A colour match does not establish that two spectra are identical.
- Photon energy, radiant power and perceived brightness are different quantities.
- The numerical and sensor examples are hypothetical; the figures are not calibrated light sources.
A colour name does not specify one wavelength
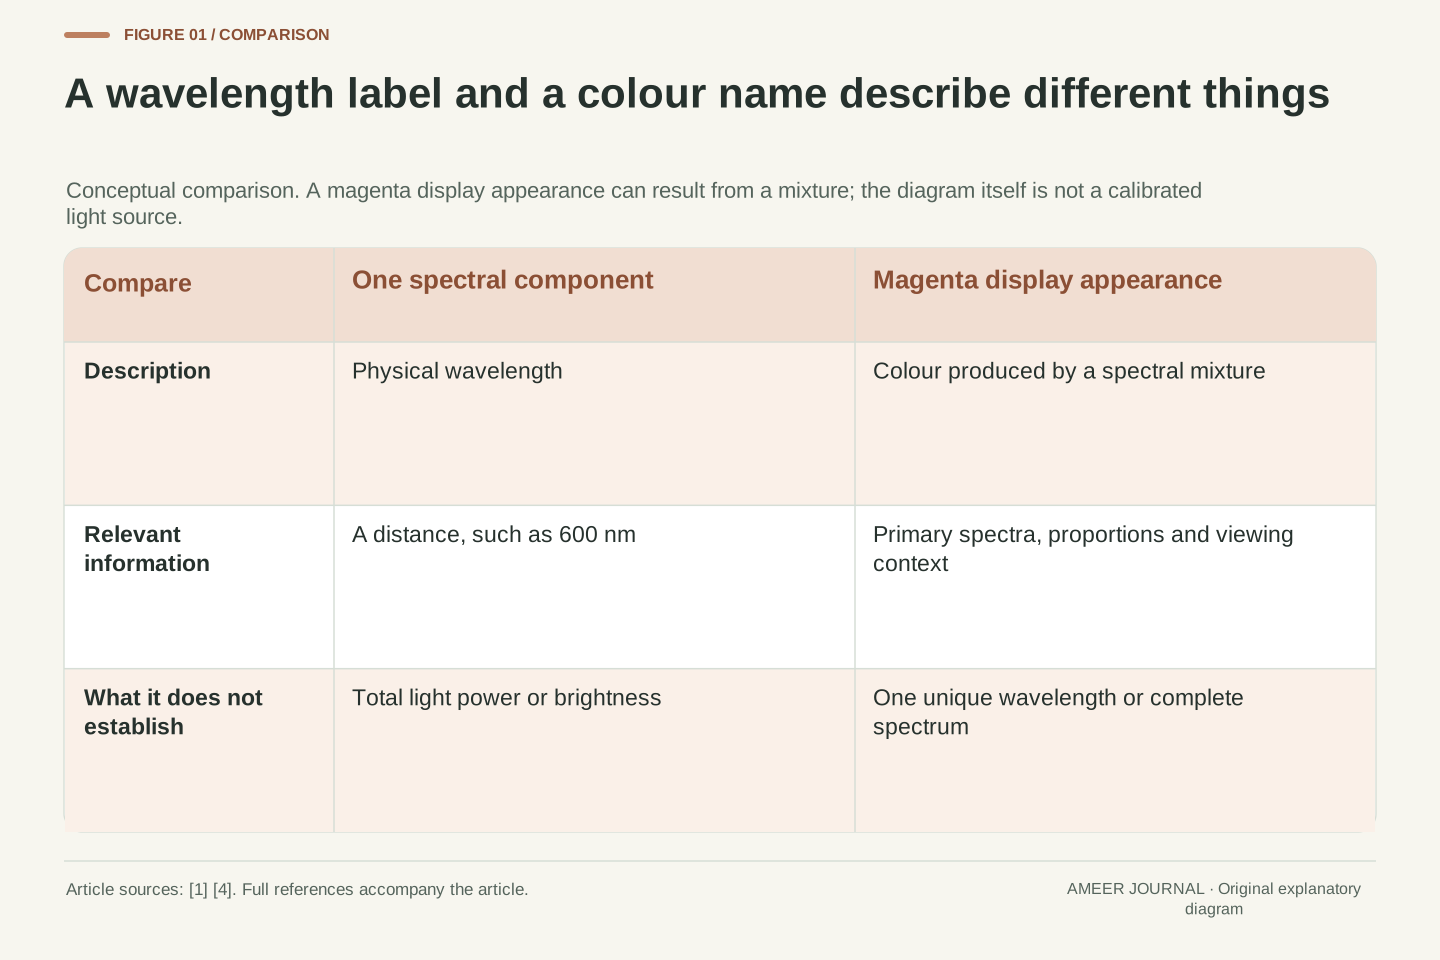
A screen can show a bright magenta shape even though there is no single magenta wavelength to point to in a rainbow. A typical colour display creates this appearance by combining contributions from its red and blue primaries. The light reaching your eyes contains a mixture. Your visual system responds to that mixture as a colour; the wavelengths do not have to merge into a new, middle wavelength. MIT's colour-science explanation describes magenta using separated blue and red parts of the visible spectrum [4].
This raises a useful question whenever you look at a phone photograph, a coloured diagram or a product's light specification: are you being told about the light itself, or about how it appears? Wavelength is a physical measurement. Magenta is a colour description. Both are meaningful, but one is not a substitute for the other. We will follow the distinction from a single wave to a screen, using small calculations and a deliberately invented sensor example. None of the coloured figures on this page is a calibrated light source or a measurement of your display.
A magenta display patch illustrates the difference between a spectral description and a perceptual description. Its appearance can be produced by adding contributions from red and blue display primaries, rather than by emitting monochromatic light at a hypothetical magenta wavelength. The resulting spectral power distribution retains contributions from the physical primaries. The visual system maps that distribution to a colour appearance. MIT's introductory spectral-band model explicitly locates magenta in a mixture of short- and long-wavelength bands with the middle band absent [4].
This article treats wavelength as a physical coordinate and colour as an observer-dependent response under specified viewing conditions. It does not assume that a colour name uniquely determines a spectrum, or that an RGB value determines a wavelength. The distinction matters when interpreting photographs, display output and optical specifications. We will use vacuum wavelength for the numerical examples, a simplified trichromatic model for colour matching, and an explicitly artificial sensor model to demonstrate information loss. These are explanatory models, not measurements of a particular screen, observer or light source.

Measure distance and repetition separately
For a wave, wavelength is the distance between repeating features such as neighbouring peaks. Frequency tells you how many cycles pass a fixed place in one second. NASA describes these as different ways of measuring the same electromagnetic wave [1]. A wavelength of 600 nanometres is a distance, not a statement that the wave repeats 600 times each second. The unit nanometre means one billionth of a metre. Frequency uses hertz, where one hertz means one cycle per second.
A drawn wave is only a model. Its height can represent the strength of an electric field, while its horizontal direction represents distance. It does not show a photon following a little wavy road through space. Electromagnetic waves involve electric and magnetic fields, and they can travel through a vacuum without needing air or water to carry them [1][6]. That is why light from distant objects can cross space. Keep the axis labels in mind: distance between peaks and the number passing each second answer different questions about propagation.
Wavelength λ is a spatial period; frequency ν is the number of oscillation cycles per unit time at a fixed location. Their units are metres and inverse seconds, respectively, with hertz used for cycles per second. A nanometre is 10^−9 m. NASA's wave description distinguishes these quantities and explains electromagnetic propagation through oscillating fields rather than through a required material medium [1][6]. An unlabeled sinusoid cannot tell the reader whether its horizontal axis represents distance or time, so a sound explanation identifies that axis first.
For the examples here, λ means vacuum wavelength and c means propagation speed in vacuum. The relation is c = λν. An electric-field-versus-position drawing visualizes a field value along space at an instant; it is not a particle trajectory. Similarly, the vertical amplitude of that drawing is not the wavelength. This interpretation keeps three distinct ideas apart: spatial repetition, temporal repetition and field strength. We will not infer optical power or perceived brightness merely from the spacing between the peaks.
Check the units in a 600-nanometre example
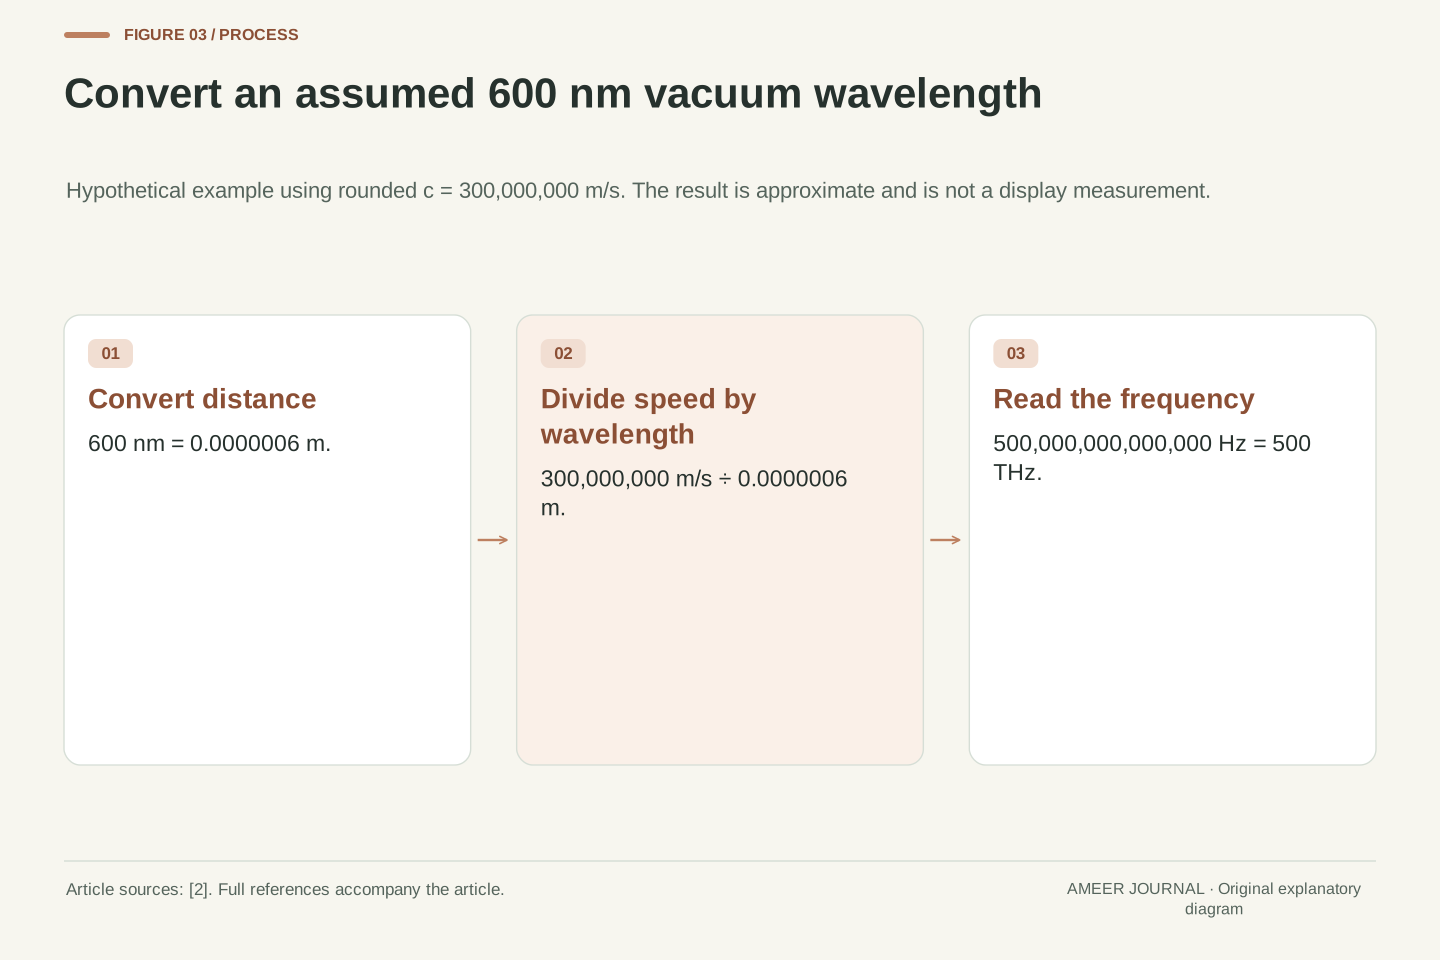
Imagine light with a single vacuum wavelength of 600 nanometres. This is a teaching assumption, not a measurement of a screen. Use the rounded speed of light, 300 million metres per second. First change 600 nanometres into 0.0000006 metres. Then divide the speed by that distance: 300,000,000 divided by 0.0000006 gives 500,000,000,000,000 cycles per second. That is 500 terahertz, where one terahertz is a million million hertz. The very large frequency is compatible with the very small wavelength [2].
Repeat the same calculation for an assumed wavelength of 400 nanometres and the result is 750 terahertz. Shorter wavelength means higher frequency when the propagation speed is held fixed. The ratio is easy to check: 600 divided by 400 is 1.5, so the second frequency is 1.5 times the first. These calculations identify properties of the assumed light. They do not mean a display's red and blue controls can be averaged to produce a wave at the average of their wavelengths. Combining light and converting units are different operations.
Take an explicitly hypothetical monochromatic component with λ = 600 nm = 6 × 10^−7 m. Using the rounded constant c ≈ 3 × 10^8 m s^−1 gives ν = c/λ ≈ 5 × 10^14 s^−1 = 500 THz. NASA gives the exact vacuum speed as 299,792,458 m s^−1 [2]; the rounded value here is intentional, so the calculated frequency is approximate. The dimensional cancellation matters: (metres per second) divided by metres leaves inverse seconds, not metres per second squared.
At λ = 400 nm = 4 × 10^−7 m, the same approximation gives ν ≈ 7.5 × 10^14 Hz = 750 THz. The frequency ratio is ν400/ν600 = 600/400 = 1.5. No observer model is needed for that conversion. Conversely, adding two optical spectra does not replace them with a monochromatic component at their mean wavelength. Frequency conversion describes one component; additive colour reproduction combines distributions of components. Keeping those operations distinct prevents an attractive but incorrect arithmetic explanation of a magenta pixel.
The eye summarizes a spectrum
Visible light covers only part of the electromagnetic spectrum. NASA gives roughly 380 to 700 nanometres as a typical visible range [3]. These numbers are a useful guide, not two universal switches that make every person's vision start and stop at exactly the same points. Within the visible range, light can contain a narrow group of wavelengths, a broad spread, or several separated groups. A spectrum describes how much light there is across those wavelengths; a colour word does not provide that whole description.
For ordinary colour vision in suitable lighting, three classes of cone receptors make different weighted responses to the incoming spectrum. They are called short-, medium- and long-wavelength cones [4]. Their sensitivities overlap. They are not three tiny meters that separately report only blue, green and red light. Each class responds across a range. The visual system uses these responses, along with context, to produce colour appearance. This explains why a few numbers can be useful for colour reproduction even though a detailed spectrum may contain far more information.
The visible interval is conventionally approximate. NASA's educational range of roughly 380–700 nm is useful orientation, while MIT uses about 400–700 nm in its simplified band model [3][4]. Neither should be treated as a universal sharp boundary for every observer and condition. A spectral power distribution specifies power as a function of wavelength; a narrowly concentrated distribution and a broad distribution are physically different even when both receive familiar colour names. A colour name is therefore insufficient input for reconstructing spectral detail.
In a simplified model of typical trichromatic vision, L, M and S cone classes provide three differently weighted integrals of the incident spectrum. Their spectral sensitivity functions overlap, rather than partitioning the spectrum into disjoint red, green and blue bins. MIT expresses the sampled version as a matrix multiplying the spectrum vector [4]. This model describes cone responses under its assumptions, not the entirety of visual perception. Adaptation, illumination and surrounding colours can change appearance; the article's colour-matching comparisons hold the viewing context fixed.
Adding red and blue does not make a middle wave
Return to the screen patch. Red and blue contributions can arrive together and produce a magenta appearance in appropriate proportions. The light is still a mixture of the display primaries. The result is not explained by taking a red wavelength and a blue wavelength, finding their numerical average, and calling that average magenta. MIT's coarse three-band model makes the point clearly: magenta combines the outer red and blue bands, while yellow combines red and green [4]. This is addition of light, not a recipe for mixing paints.
Violet needs a separate mention. The short-wavelength end of a visible spectrum can appear violet, so the claim is not that every colour people casually call purple must come from two separated bands [3]. Everyday colour names overlap and vary. Magenta is the useful example here because it highlights a mixed-light appearance that the single-wavelength rainbow does not supply. Also, real display primaries have their own spectral shapes. Calling a primary red describes its appearance; it does not establish that the screen emits exactly one red wavelength.
For additive display output, the emitted spectrum is a weighted sum of the primary spectra. Increasing a red contribution and a blue contribution can produce a magenta appearance while leaving separated spectral contributions. It does not perform wavelength averaging. MIT illustrates this with a deliberately coarse partition into 400–500, 500–600 and 600–700 nm bands: the short-plus-long combination is magenta in that introductory model [4]. Those bands are a conceptual colour-class example, not a specification of actual display emitters or a precise colour-matching recipe.
Distinguish nonspectral magenta from spectral violet. Violet belongs near the short-wavelength end of the visible spectrum; grouping both under the everyday word purple would obscure the physical distinction [3]. The relevant statement is that a magenta appearance requires a spectral mixture rather than a unique monochromatic magenta coordinate. Real primary spectra can be broad, and the proportions required for an appearance depend on the device and observer conditions. An RGB command describes control of a reproduction system; without the system's spectral characteristics, it is not a spectral measurement.
Different spectra can give the same colour match
Different light mixtures can produce a matching colour for an observer under specified conditions. Such mixtures are called metamers [4]. This is why a display can reproduce the appearance of a photographed object without reproducing every wavelength that originally came from it. Matching colour is useful, but it does not prove that two physical spectra are identical. If you need the spectral details, three colour values are not enough to recover all the information that may have been present.
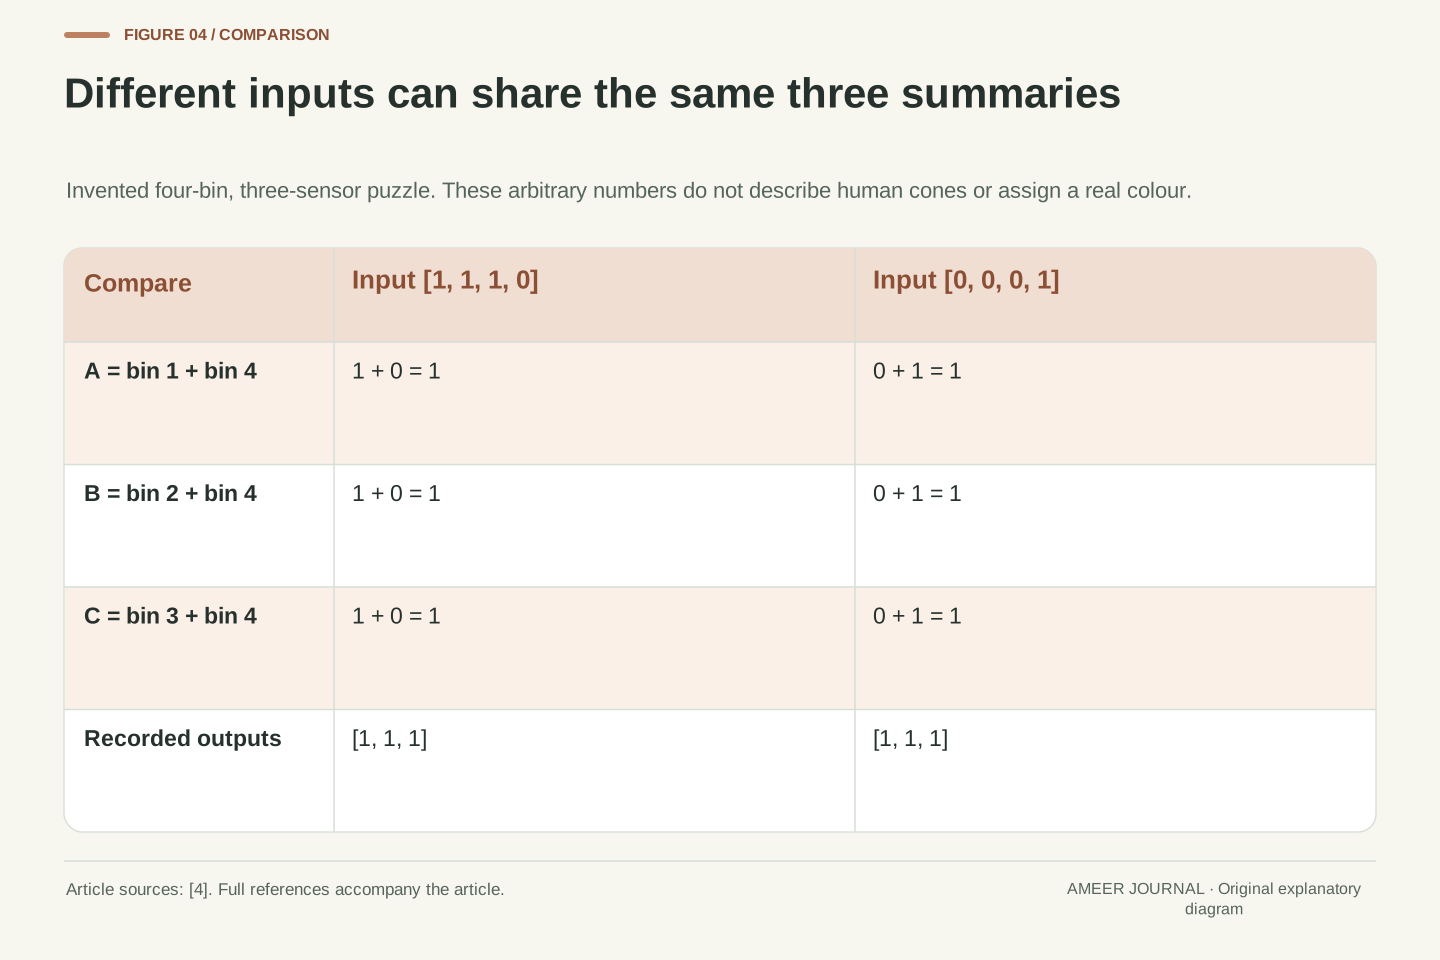
Here is an invented number puzzle that shows why. Imagine four light bins and three imaginary sensors. Sensor A adds bins one and four; B adds bins two and four; C adds bins three and four. The input [1, 1, 1, 0] gives outputs [1, 1, 1]. The different input [0, 0, 0, 1] gives exactly the same outputs. These are artificial sensors and arbitrary units, not the human eye. The puzzle demonstrates that a smaller set of summaries can match while the original inputs differ. It does not assign a real colour to either input.
Metamerism means that different spectral distributions produce a colour match under a defined observer model and viewing context [4]. In the sampled linear model, many spectral vectors can share the same three cone-response projections. Colour reproduction can target those responses without reconstructing the original spectrum. This is an information constraint, not a failure of a particular camera: a small set of colour coordinates does not uniquely encode an arbitrary higher-dimensional spectral distribution. Observer and context qualifiers remain necessary when interpreting a match.
An original artificial example makes the nonuniqueness inspectable. Define four nonnegative spectral-bin values x1…x4 and three fictional sensors: A = x1 + x4, B = x2 + x4, C = x3 + x4. Both x = [1,1,1,0] and x′ = [0,0,0,1] yield [A,B,C] = [1,1,1]. Their difference [1,1,1,−1] lies in this invented measurement matrix's null space. Neither spectrum nor sensitivity matrix represents measured human physiology. The example proves only the stated algebraic ambiguity, while the cited cone-response model explains why a related distinction matters in colour science.
Photon energy is not the whole brightness story
Shorter-wavelength light has higher energy per photon. NASA gives the relationship between photon energy and frequency, and explains that blue photons carry more energy than red photons [2][6]. In our hypothetical 400- and 600-nanometre examples, the 400-nanometre photon carries 1.5 times the energy of the 600-nanometre photon. This follows from the same frequency ratio. It does not mean every blue-looking light source emits more total energy, or looks brighter, than every red-looking one.
The number of photons arriving over time also matters. A weak source can supply fewer photons even if each has more energy. To compare physical power, you need the energy arriving per second, not only the energy of one photon. To compare perceived brightness, you also need to account for human wavelength sensitivity and the viewing situation. NIST distinguishes measurements of optical radiation from measurements weighted for human vision [5]. A colour label alone leaves both the total amount of light and the observer's response unresolved.
The comparison can also run the other way. Suppose the two hypothetical sources deliver equal physical power. Because each 400-nanometre photon carries 1.5 times as much energy, that source needs only two-thirds as many photons per second as the 600-nanometre source. Multiplying two-thirds by 1.5 gives one, so the power totals match. This is a check on energy accounting. It still does not say that the two lights look equally bright, and it says nothing about the power used by the devices that produce them.
For a monochromatic component, photon energy is E = hν = hc/λ [2][6]. Therefore E400/E600 = 600/400 = 1.5 for the assumed vacuum wavelengths. With equal photon arrival rates, the 400 nm component would carry 1.5 times the radiant power of the 600 nm component. That equal-rate condition is essential: P = Ndot × E, so a larger photon energy does not determine the total power without the photon flux. The comparison is analytical and does not describe an actual lamp.
Radiometric power and visual brightness also require different interpretations. Photometry weights optical radiation according to a specified visual response, whereas a watt describes physical power. NIST's candela explanation emphasizes the eye's wavelength-dependent sensitivity and its dependence on conditions [5]. A higher-energy photon does not establish a greater perceived brightness per unit radiant power. We consequently do not convert the 1.5 photon-energy ratio into a brightness ratio, or treat a screen colour as a measurement of luminous intensity. Each conclusion requires its own quantity and boundary.
At equal radiant power, the photon-flux ratio reverses: Ndot400/Ndot600 = E600/E400 = 2/3. The consistency check is (2/3) × 1.5 = 1. This second comparison holds power fixed, whereas the first held photon flux fixed; they are different experimental assumptions rather than conflicting results. Both describe optical energy crossing a stated observation boundary. Neither computes the electrical input power of a source, its conversion efficiency or its perceived brightness. Those would require information not supplied by wavelength and photon counting alone.
A screen and a coloured object form light differently
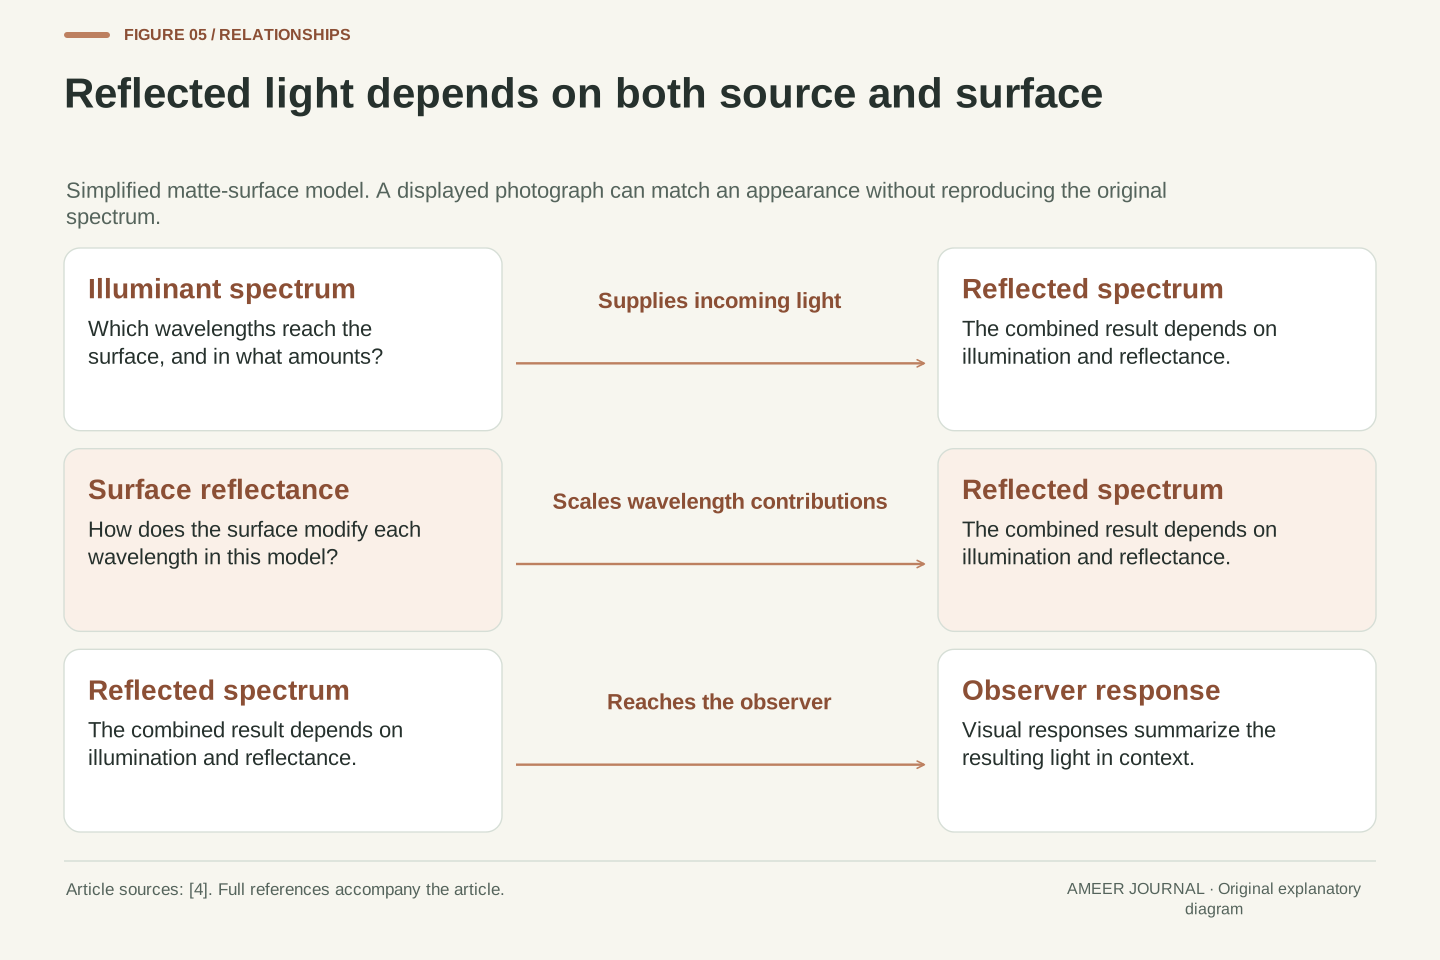
A screen's primary contributions are not the same problem as light reflected by a coloured object. For a simple matte-surface model, the reflected spectrum depends on both the light falling on the object and the surface's reflectance at each wavelength [4]. The object cannot be understood from a colour name alone. A surface viewed under one lamp can send a different mixture toward your eye under another lamp, even if the surface itself has not changed.
Imagine a purely hypothetical surface that reflects a chosen wavelength strongly, but the lamp supplies no light at that wavelength. There is then no incoming contribution there for the surface to reflect in this simple model. The reasoning concerns the product of illumination and reflectance; it does not promise a particular colour appearance for a real material. A photograph adds another stage: it records and then reproduces a colour signal through a camera and display. The visible result can be useful without being a complete record of the original light spectrum.
For the diffuse-reflection approximation used in MIT's discussion, the outgoing spectrum is proportional to the wavelength-by-wavelength product of the illuminant spectrum and surface reflectance, with geometry represented by a scale factor [4]. This is a deliberately bounded model. Real reflection can include directional and specular effects; the article does not claim that one scalar reflectance curve captures every material and viewing geometry. Even within the simple model, an unchanged surface can produce different outgoing spectra when illumination changes.
A useful limiting case is an illuminant whose contribution is zero at a particular wavelength. Multiplying by any finite passive reflectance in that model still gives zero at that wavelength. This is a hypothetical reasoning example, not a measured material or an account of fluorescence. Camera capture and display reproduction then introduce further response functions and primary spectra. A colour match between original scene and displayed image need not preserve the original spectrum, and an attractive photograph cannot by itself establish the spectral reflectance of the depicted surface.
A spectrum can reveal details that colour hides
A colour match can hide differences that a spectrum separates. NASA describes dark absorption lines in stellar spectra as clues about which materials interact with the light [3]. The important point is the pattern across wavelengths, not merely whether the star's photograph looks yellow, red or blue. A broad colour description compresses information. A more detailed spectrum can reveal features that never receive a separate everyday colour name.
The same distinction helps with ordinary images. A picture of a spectrum on your phone is a display's representation of measurements; the pixels are not recreating all those measured wavelengths. Read the wavelength axis and the explanation of what the vertical values mean. Ask whether a graph shows measured power, reflectance or a teaching sketch. The figures in this article are explanatory diagrams with labelled assumptions. None supplies data from a spectrometer, and the invented sensor numbers should not be used to identify an unknown lamp, material or astronomical object.
Spectroscopy retains wavelength-dependent structure that a few broad colour coordinates can discard. NASA's visible-light explanation describes absorption-line patterns and reflectance signatures as evidence about interacting materials [3]. Such interpretation depends on spectral features, measurement conditions and an appropriate physical model, rather than on an overall display colour. A matching trichromatic appearance therefore does not imply equivalent usefulness for spectral analysis. The information requirements of colour reproduction and material investigation differ.
When reading a spectral figure, distinguish the measured quantity from the image used to present it. Wavelength may be the horizontal coordinate, while the vertical coordinate could describe spectral power or reflectance; those are not interchangeable units. A screenshot adds another colour-reproduction stage and does not become a calibrated source containing the original spectral components. Our diagrams contain explanatory relationships and explicitly hypothetical arithmetic only. No instrument response, line identification, display characterization or material classification was measured for this article.
Read a light or display claim in four steps
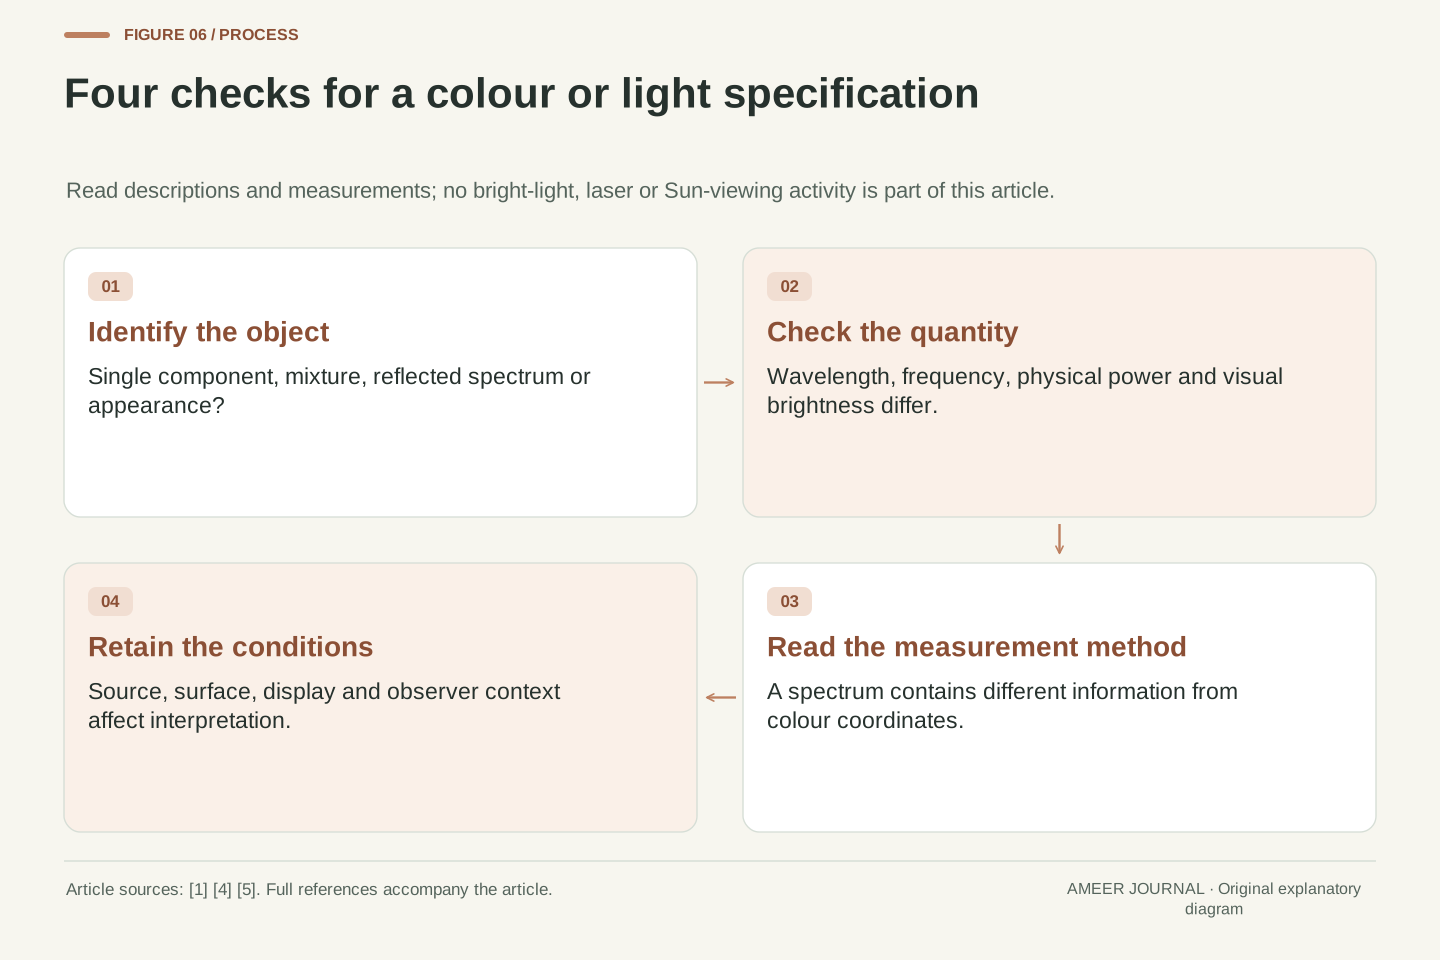
First identify the thing being described: a single spectral component, a mixture of emitted light, a reflected spectrum or a colour appearance. Then read the units. Nanometres describe wavelength, hertz describes frequency, and watts describes physical power. Next ask how the observation was made. A spectrum measurement and a three-channel colour record preserve different information. Finally check the conditions: source, surface, display and viewing context can all affect what reaches the eye and how it appears [1][4][5].
You can check the central idea using only the written examples. Recalculate 600 nanometres as 500 terahertz with the stated rounded speed. Verify that the two invented four-bin inputs produce the same three sensor outputs. Explain why neither result assigns a single wavelength to the magenta shape on a screen. These are paper exercises; no bright-light, laser or Sun-viewing activity is needed. The useful conclusion is a precise vocabulary: a wavelength characterizes a physical component, a spectrum describes a mixture, and a colour match describes an appearance under particular conditions.
A practical reading sequence starts with the object and quantity: monochromatic component, spectral distribution, reflected spectrum or perceptual match. Record the units and the relevant assumptions, including vacuum wavelength for the conversions here. Then identify the measurement system: spectral sampling and trichromatic colour capture have different information content. Finally retain the observer, illumination and reproduction conditions needed to interpret the claimed appearance [1][4][5]. These distinctions are more informative than assigning one familiar colour word to every stage.
The two original checks are deliberately independent. The 600 nm conversion verifies ν ≈ 500 THz using rounded c; the four-bin example verifies nonunique inputs under a stated three-sensor mapping. Neither establishes the spectrum emitted by an unspecified screen, nor predicts an exact observer match. No physical exposure experiment is required. For the magenta pixel, the supported account is additive spectral contributions interpreted by a visual system, with device and context limits retained. That account avoids both wavelength averaging and the assumption that a matching colour recovers all the original optical information.
Sources & further reading
Explore the references behind this guide. External pages may change after our review.
- Anatomy of an Electromagnetic Wave - NASA ScienceNASA · Accessed 6 Nov 2026
- Electromagnetic SpectrumNASA / Goddard Space Flight Center · Accessed 6 Nov 2026
- Visible Light - NASA ScienceNASA · Accessed 6 Nov 2026
- 8 Color – Foundations of Computer VisionMIT / Foundations of Computer Vision authors · Accessed 6 Nov 2026
- Candela | NISTNational Institute of Standards and Technology · Accessed 6 Nov 2026
- Spectroscopy 101 – Light and Matter - NASA ScienceNASA / Webb · Accessed 6 Nov 2026
Article updated 6 Nov 2026.
Found something we should revisit?
Good explanations get better with thoughtful feedback.