What you’ll take away
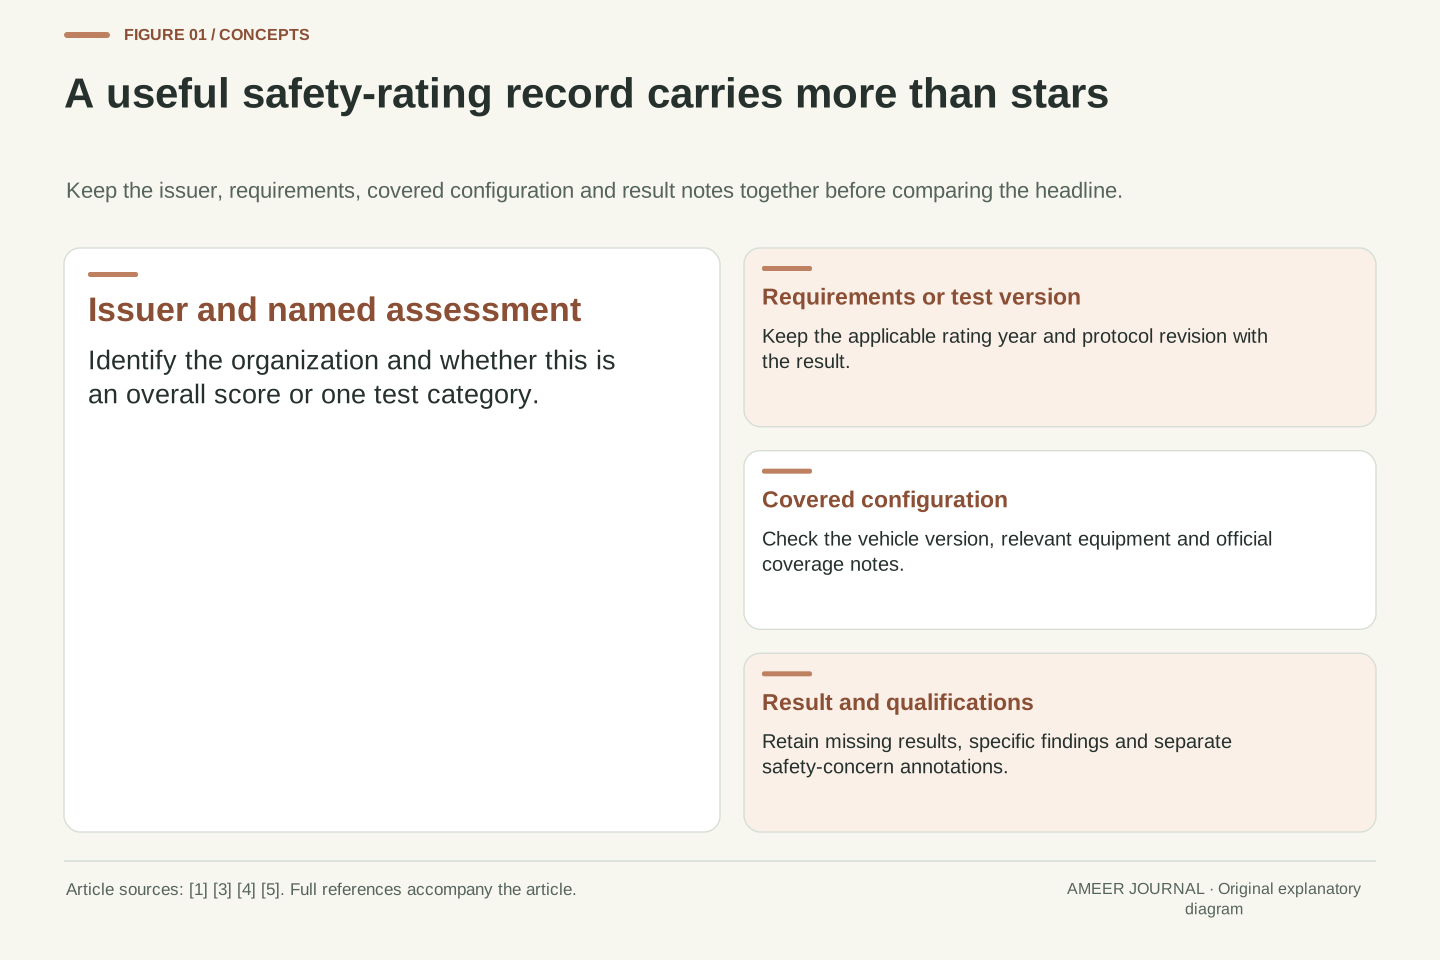
- Compare complete rating records: issuer, requirements, covered configuration, category, result and notes.
- NHTSA frontal and overall comparisons require both the same class and a weight difference within 250 lb. Other categories and organizations have their own scope.
- Displayed star labels do not provide the underlying inputs needed to reconstruct an official overall score.
- Equipment, assessment year, carried-over coverage and rating expiry are separate parts of applicability.
- An untested condition and a separate safety concern must stay visible beside the issued score.
Start with the record behind the stars
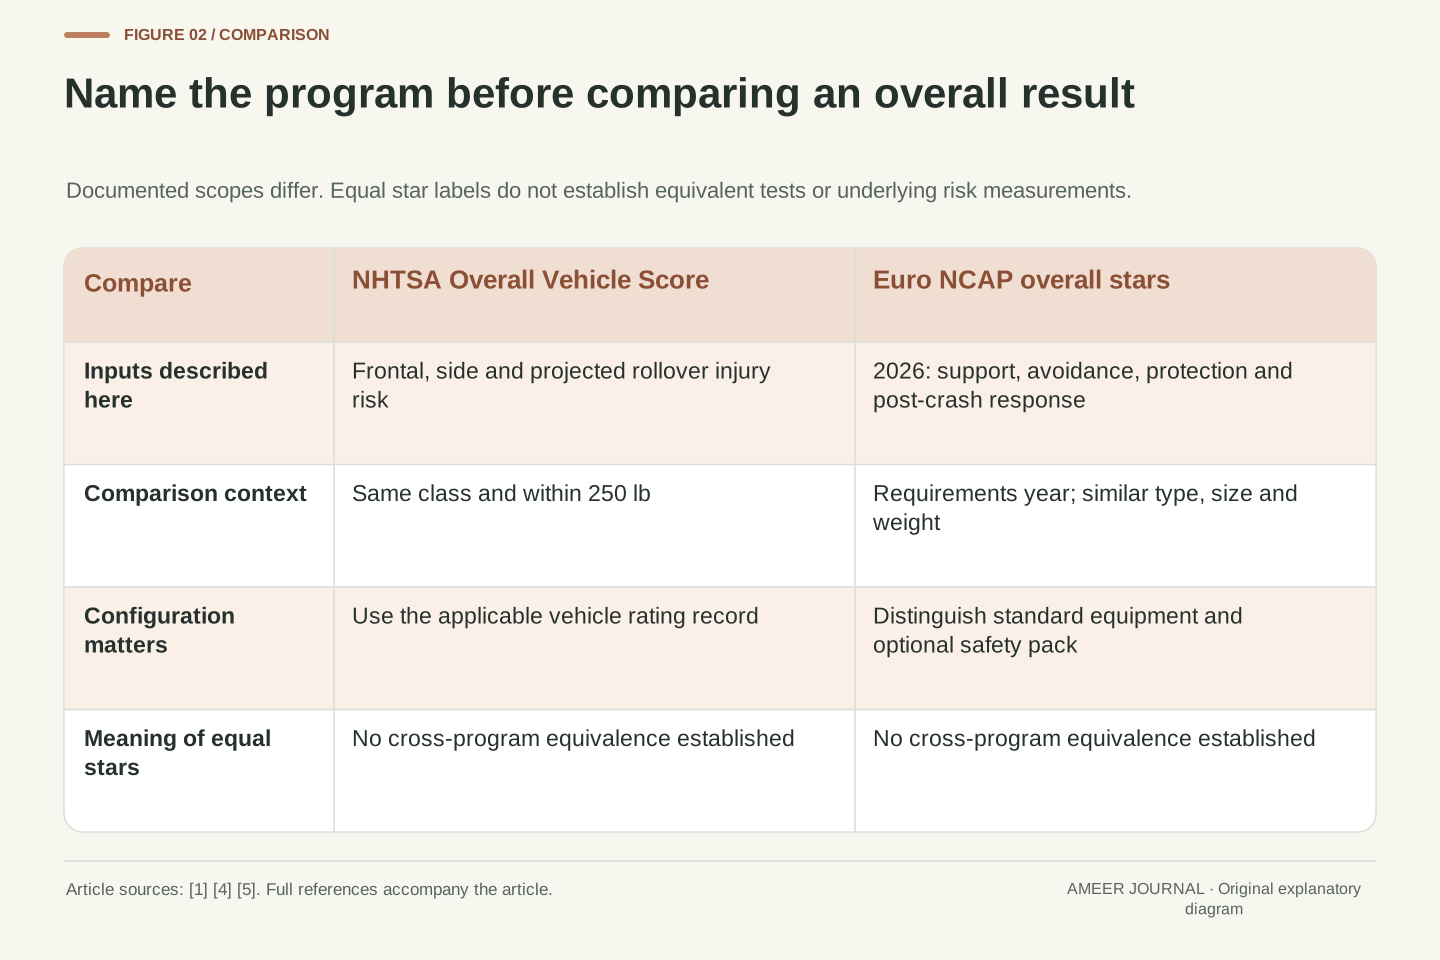
Two cars can both be advertised with five stars while the labels answer different questions. The organization, test year, equipment and category belong to the result. NHTSA explains its Overall Vehicle Score through frontal, side and rollover information; Euro NCAP describes a broader assessment that also includes avoiding crashes and responding after them. A shared symbol does not make the two programs interchangeable. [1][4]
Treat a rating like a labelled evidence record. Write down who issued it, which vehicle versions it covers, the requirements used and whether the number is an overall result or one part of the assessment. Then read the conditions attached to that record. This order matters: comparing the stars first can hide a mismatch that no amount of arithmetic will repair.
This article uses the organizations’ public explanations retrieved on 7 November 2026. Its invented vehicle cards and number profiles are reading exercises, not crash tests or assessments of real cars. The aim is to identify which comparison a published result supports. That gives the stars a useful job without turning them into a prediction of the outcome of a particular collision.
A safety rating is a result within an assessment system. Its identity includes the issuing organization, protocol or assessment year, covered vehicle configuration, reported category and applicable qualifications. NHTSA’s Overall Vehicle Score and Euro NCAP’s overall stars do not have identical inputs or meanings. The former’s published explanation combines injury-risk information from frontal, side and rollover assessments; the latter includes protection, prevention and post-crash considerations. [1][4]
A compact way to preserve that identity is a record containing issuer, requirements, configuration, category, result and notes. A comparison operates on those records, not on detached numbers. If two records differ in their test definitions, equal labels do not establish equal underlying measurements. If a record does not apply to the vehicle under discussion, even an accurately copied score answers the wrong question.
The program descriptions here were retrieved on 7 November 2026. All vehicle weights and numerical profiles introduced below are stipulated examples. They illustrate comparison logic and information loss, without supplying a new scoring system, predicting personal injury risk or claiming that a real vehicle was tested. Keeping the record identity intact is the central method.
Speed alone does not describe a crash test
NHTSA describes its frontal test as a vehicle hitting a fixed barrier at 35 mph. Its explanation connects that test to a collision between similar vehicles of equal weight. IIHS describes its updated moderate overlap test as a vehicle travelling at 40 mph into a stationary barrier, with 40 percent of the vehicle’s front overlapping it. Those are different stated arrangements. [1][2]
It is tempting to put the two speeds in a column and declare the second test simply tougher. That skips the shape of the contact, the vehicle mass, the occupant positions and what the assessors measure. A speed describes one part of the setup. The overlap describes another. The final result depends on the program’s complete procedure and assessment, so neither speed alone nor their ratio creates a conversion between ratings.
A useful reading habit is to sketch the question in words before examining the score: which vehicle movement, which contact arrangement and which occupants are represented? Keep those details beside the result. The comparison then becomes specific enough to be useful. “Performed well in this frontal setup” carries clearer information than an unqualified claim that one laboratory number covers every frontal collision.
The NHTSA frontal description specifies a 35 mph fixed-barrier impact and frames it as representing a collision between vehicles of equal weight. The IIHS updated moderate overlap description specifies 40 mph and 40 percent frontal overlap with a stationary barrier. These are source-defined test conditions, not two points on a common one-dimensional severity scale. [1][2]
Speed, overlap geometry, mass and restraint response are separate variables. A ratio of the two published speeds is therefore not a justified transformation of injury criteria, category ratings or overall scores. Even a calculation using speed squared would describe only a limited energy relationship under additional assumptions; it would not reproduce the barrier interaction or the organizations’ scoring methods. The present comparison makes no such severity conversion.
Test identity is a prerequisite for interpreting a difference in results. A stronger conclusion would require the appropriate protocol, applicable vehicle record and relevant measurement definitions. For a reader, the practical gain is to keep the setup and outcome paired. A test can provide valuable evidence about its declared collision configuration while leaving other configurations unmeasured by that particular result.
Ask which seat and which response were assessed
The occupants represented in a test matter as much as its headline. IIHS says the moderate overlap assessment was updated in 2022 to include rear-seat protection. Its described setup has an average-size male dummy in the driver’s seat and a smaller dummy, representing a small woman or a 12-year-old child, behind the driver. Both are belted. Adding that rear position adds a question the earlier setup did not answer in the same way. [2]
The researchers also look beyond whether the cabin appears intact. The cited IIHS description covers intrusion into the occupant space, signals from the dummies, belt loading and observations of their movement. Extra measurements on the rear dummy help assess the chest response there. A photograph of the outside of a damaged car cannot substitute for those different records. [2]
When a result interests you because someone often rides in the back, open the details for that seat and test version. A front-seat result is not automatically a rear-seat result. Equally, the size represented by one test dummy does not mean every person of that age or size will respond identically. The dummy description identifies the assessment setup; it is not a child-restraint fitting instruction.
Occupant representation is part of the protocol boundary. IIHS identifies its 2022 moderate overlap update as incorporating rear-seat protection. In the described test, an average-size male Hybrid III dummy occupies the driver’s seat, while a smaller Hybrid III representing a small woman or a 12-year-old child is belted in the second row behind the driver. The seat and anthropometric representation must remain attached to any inference. [2]
The published assessment uses several types of evidence: compartment intrusion, dummy signals associated with injury risk, rear belt tension and chest pressure information, and observations of restraint interaction and dummy motion. These measurements are not interchangeable. A structurally preserved space does not, by itself, specify the loads experienced by the represented occupant; exterior deformation likewise does not determine the overall restraint assessment. [2]
This creates a useful distinction between a test’s vehicle setup and its occupant-specific findings. Before carrying a result into a comparison, check whether the relevant seating position and updated procedure are included. Extending a front-position finding to a rear position, or a dummy representation to every real occupant, adds assumptions not supplied by the headline. The stated dummy age range also provides no independent guidance on a child’s appropriate restraint.
Apply the comparison rule before comparing the stars
NHTSA’s published rule limits comparisons of frontal ratings and Overall Vehicle Scores to vehicles in the same class and within 250 pounds of the vehicle being rated. Its explanation allows side and rollover rating comparisons across classes. The limit is therefore attached to particular results, not a universal ban on every cross-class comparison. [1]
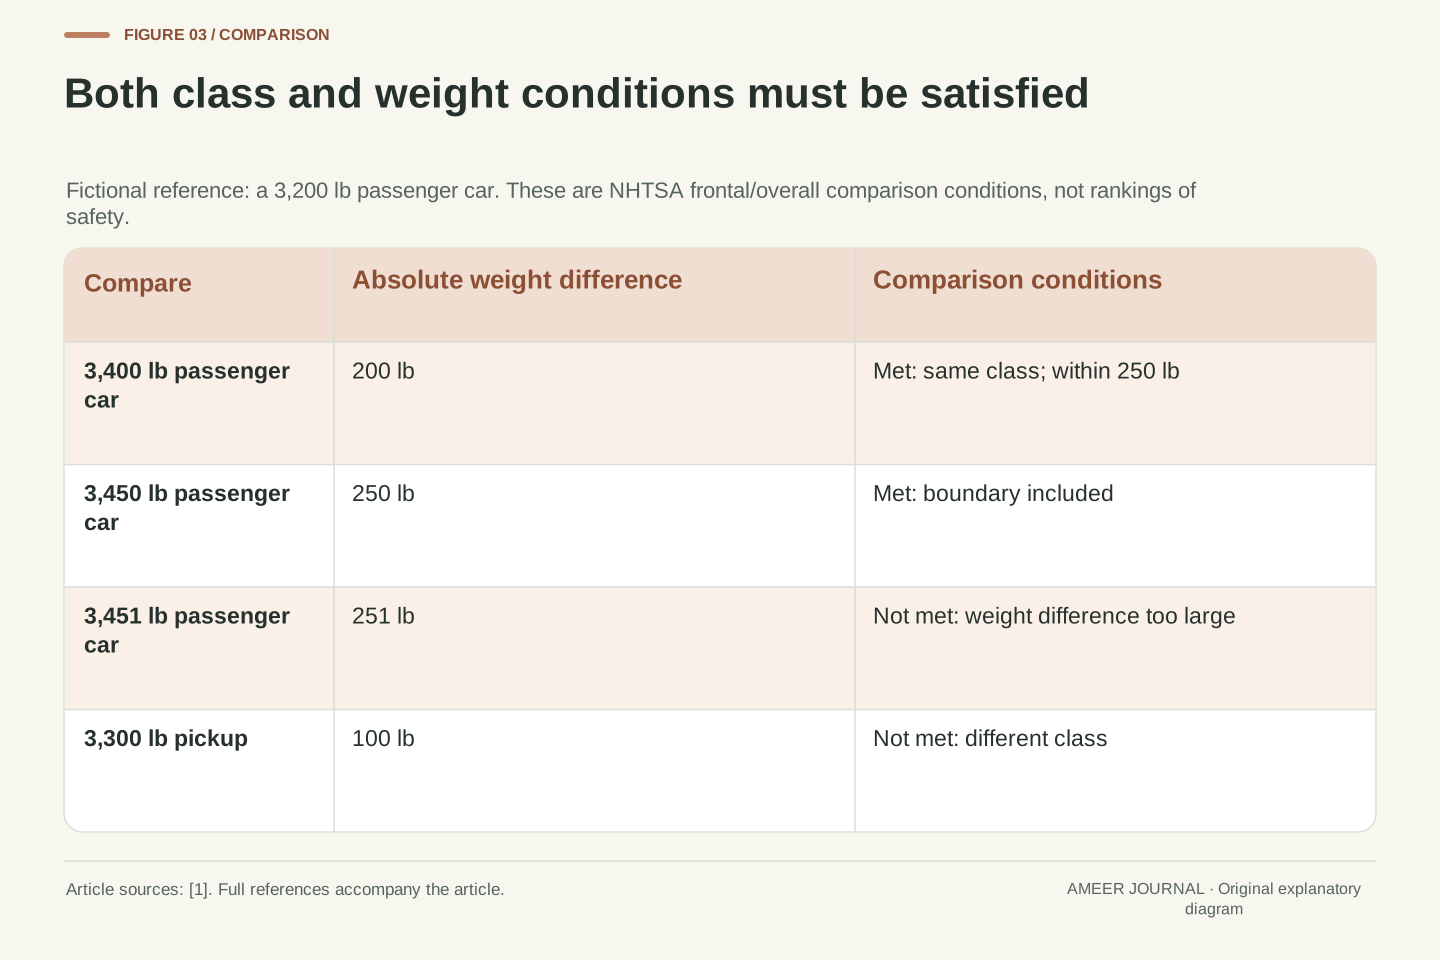
Use an invented reference passenger car weighing 3,200 pounds. Another passenger car at 3,400 pounds differs by 200 pounds and meets the stated class-and-weight conditions. At 3,450 pounds, the difference is exactly 250 and still meets them. At 3,451 pounds, the difference is 251 and falls outside. A pickup at 3,300 pounds differs by only 100 pounds, but fails the same-class condition. Passing one condition cannot replace passing both.
These cards establish eligibility for that comparison, not which car is safer. The extra pound in the boundary example does not create a sudden physical jump in crash protection; it crosses a published comparison limit. Likewise, a car that meets the conditions is not guaranteed to have a better result. First decide whether the comparison is supported, then read the actual ratings and their notes. IIHS separately limits its moderate overlap comparisons to vehicles of similar weight; do not automatically import NHTSA’s exact numeric limit into that program. [2]
For NHTSA frontal and Overall Vehicle Score comparisons, the stated conditions are conjunctive: the vehicles must share a class, and their weights must differ by no more than 250 pounds. NHTSA gives different comparison scope for side and rollover results. These are result-specific rules, so the category cannot be removed from the eligibility decision. [1]
Let the fictional reference be a 3,200 lb passenger car. The absolute weight differences for passenger cars at 3,400, 3,450 and 3,451 lb are respectively 200, 250 and 251 lb. The first two meet the stated conditions; the third fails the weight condition. A 3,300 lb pickup has a difference of only 100 lb, but fails the class condition. This is a Boolean eligibility calculation, not a model of impact response or injury risk.
The inclusive boundary concerns the scope of the comparison. It does not claim a physical discontinuity between otherwise hypothetical 3,450 and 3,451 lb vehicles. Eligibility also says nothing about the direction or magnitude of a performance difference. IIHS’s moderate overlap page specifies similar vehicle weight without supplying this same numerical boundary. [2] Retaining each organization’s own language avoids silently converting an explicit rule in one program into an invented rule in another.
Check what the overall assessment includes
The phrase “crash rating” can hide assessments that reach beyond a collision itself. Euro NCAP’s retrieved guidance describes its framework from 2026 through four named areas: Safe Driving, Crash Avoidance, Crash Protection and Post-Crash Safety. The areas cover different stages and functions, including driver support, avoiding incidents, limiting injury and helping the emergency response. [4]
That matters when interpreting the overall stars. They are not a standalone measurement of body strength, nor proof that one assistance feature will work in every situation. A structural finding, a prevention assessment and a rescue-related assessment answer different questions even when they contribute to one published result. Open the relevant detail when your question concerns one of those functions.
Older reports also need their own framework. The same Euro NCAP explanation describes the assessment areas used through 2025 separately from the 2026 structure. A familiar heading on an older report should not be treated as a complete map of the newer system. Nor should you carry an old combination rule forward just because both versions still use stars. Preserve the named program and requirements before comparing the headline. [4][5]
An overall rating’s domain is defined by its inputs. Euro NCAP’s public explanation retrieved here presents a 2026 structure with Safe Driving, Crash Avoidance, Crash Protection and Post-Crash Safety. Those named areas span assistance, incident prevention or mitigation, protection and the post-crash response. They are not interchangeable measurements of a single physical property. [4]
For interpretation, separate the overall aggregation from the component question. If the question concerns occupant protection in a particular setup, examine that evidence. If it concerns assistance capability, examine the relevant assessment conditions. A high overall label does not erase the boundaries of either component. It also provides no direct numerical conversion to NHTSA’s differently defined Overall Vehicle Score.
Protocol continuity must be established rather than inferred from an unchanged visual scale. Euro NCAP’s page distinguishes the areas through 2025 from its 2026 framework, and its FAQ identifies the rating year as the requirements against which the vehicle was assessed. [4][5] Applying an earlier limiting rule to a later framework without the corresponding protocol would invent continuity. The stable zero-to-five display does not, by itself, establish stable tests, inputs or thresholds.
An overall score is not the average of displayed stars
NHTSA explains that its Overall Vehicle Score uses the injury probabilities behind frontal and side results, plus projected injury probability associated with rollover resistance. The calculation weights these inputs to reflect the proportions of real-world injuries associated with the crash types and compares the result with the fleet average. It does not describe simply adding the displayed category stars and dividing by their count. [1]
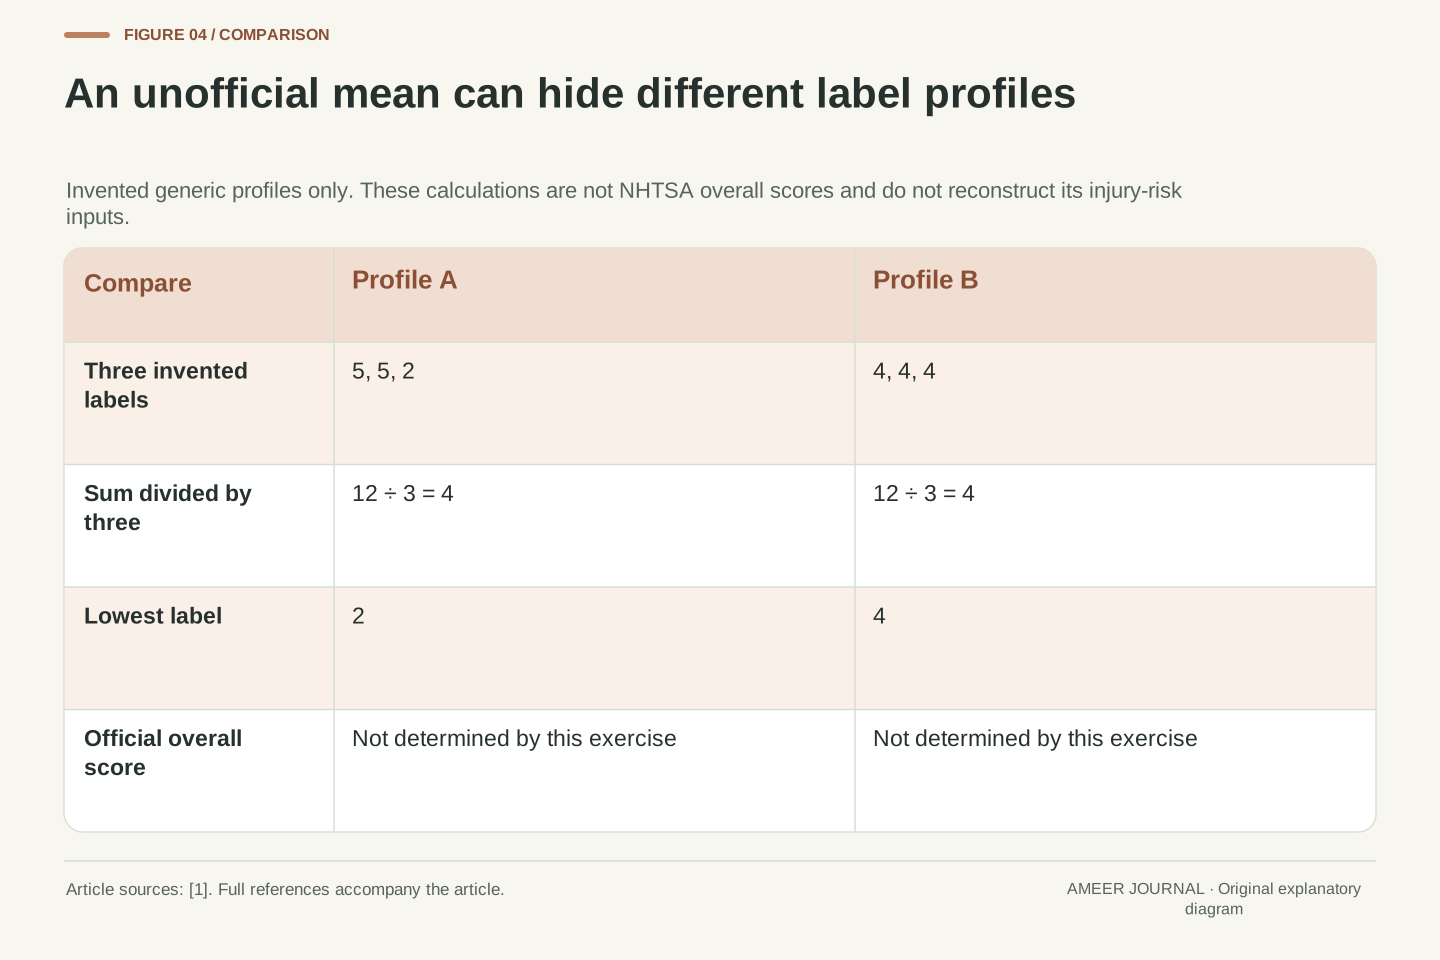
To see why that shortcut can hide information, invent two three-label profiles: 5, 5, 2 and 4, 4, 4. Each has an arithmetic mean of 4, because each totals 12 across three labels. Yet one profile contains a low value the other does not. These are generic number cards, not real vehicles or official overall scores. The exercise shows how a chosen summary can discard the pattern beneath it.
There is a second problem with treating stars like ordinary measurement units. Equal steps between labels do not establish equal changes in the underlying injury-risk quantities. You cannot recover NHTSA’s weighted calculation from a mean of those labels. Read the official overall result as issued, then use the category detail to understand it. A convenient homemade average would replace the documented method with a different, unsupported one.
NHTSA’s published aggregation operates on injury-risk quantities, not on the displayed ordinal labels alone. It uses the probabilities underlying frontal and side ratings together with a projected injury probability based on rollover resistance, applies weights associated with real-world injury proportions, and compares the combined result with the fleet average. The visible category stars are therefore insufficient inputs for reconstructing that calculation. [1]
Consider the stipulated profiles A=(5,5,2) and B=(4,4,4). Their arithmetic means are both 12/3=4, while their minimum labels are 2 and 4 respectively. This deliberately unofficial operation demonstrates a many-to-one summary: different profiles map to the same mean. It neither establishes a ranking between actual vehicles nor supplies the missing underlying probabilities or official weights.
An ordinal scale provides ordering without necessarily defining equal intervals in the measured or modelled quantity. Consequently, arithmetic on the labels adds an interpretation that the labels alone do not justify. The problem is not solved by rounding a homemade mean to the nearest star. The correct result must come from the program’s specified calculation and applicable record; category findings then remain available for questions the overall summary compresses.
Match the equipment to the published result
A car’s name may cover more than one equipment configuration. Euro NCAP explains that some models receive two ratings: one for the standard safety equipment fitted to every version sold across Europe, and another for an optional safety pack. The higher figure belongs to the pack-equipped configuration in that record. Seeing it beside a model name does not establish that every example of the model has the required equipment. [4]
Imagine a fictional listing that displays a model’s higher pack rating while its equipment record does not establish whether the pack is present. The useful next fact is the configuration, not another calculation involving the stars. Until the applicable equipment is confirmed, the higher result cannot simply be attached to that particular vehicle. If the pack is confirmed, you still need the correct rating record and its applicability conditions.
This is an identity problem rather than a reason to distrust testing. A carefully measured result can be misused when the subject changes. Keep the standard-equipment and optional-pack records distinct, and check the tested or covered version in the organization’s published information. Do not infer an equivalent safety specification from similar exterior styling, a shared model badge or an advertisement that omits the qualification.
Rating applicability includes the assessed safety specification. Euro NCAP’s dual-rating explanation distinguishes a baseline based on standard safety equipment across European versions from a higher result associated with an optional safety pack. The two records are conditional on different configurations. [4] A model-level name is therefore not a sufficient key for assigning one of them to an individual example.
In an original hypothetical, a listing supplies the model identity and the pack-associated star label, but the equipment record leaves the pack unspecified. The missing fact is configuration membership. No numerical operation on the rating can supply it. The appropriate conclusion is that applicability of the higher record is unestablished, rather than that the vehicle necessarily has either the higher or lower configuration.
Once the specification is confirmed, retain the relevant year, market scope and coverage notes as well. This is a general evidence-matching principle: precision in the measurement does not compensate for an incorrect subject identifier. It does not authorize a consumer to extend a rating to a differently equipped vehicle. Use the program’s stated coverage instead of assuming that shared branding, appearance or an apparently similar feature list makes two configurations equivalent.
A rating year identifies requirements, not a birthday
Euro NCAP says the year attached to its stars identifies the rating requirements used. It is not simply the year the individual car was manufactured. The organization updates its procedures, so a five-star result from one assessment year and a five-star result from another may have been earned under different conditions. Its guidance says comparisons across years are meaningful only when changes to the rating system were minor. [4][5]
Separate three dates when reading a record: the requirements or rating year, the model or version information, and the manufacture date of the particular vehicle. They can be related without being the same field. A recent manufacture date does not automatically turn an earlier assessment into a test against the latest requirements. Conversely, an older rating date does not mean the published historical test never happened.
The useful question is what changed between the assessments. Was the vehicle different, was the test different, or were both different? A lower label after a new assessment cannot by itself tell you which change caused it. Keep the criteria and configuration in view before interpreting the direction of the stars. This prevents a change in the measuring framework from being mistaken for a demonstrated physical change in a particular car.
Euro NCAP defines the displayed rating year as the year of requirements against which the vehicle was assessed. It separately explains that protocol evolution limits comparisons between different years. [4][5] This makes the year a measurement-context identifier, not merely an age marker. A manufacture date does not substitute for it, and a model-year label should not silently overwrite it.
Three fields help keep the inference explicit: assessment requirements, covered model/configuration and individual production date. A difference in the first changes the evaluation framework; a difference in the second may change the subject; the third helps establish which applicability period and version are relevant. Conflating them makes a score appear more current, or less meaningful, than the underlying record establishes.
Suppose two records have different star labels and different requirements. Their difference is not an isolated estimate of vehicle deterioration or improvement: the evaluator changed too. Establishing a causal explanation would require the appropriate component evidence and comparable conditions. The published rating can still be read within its own framework. What is unsupported is treating the two headline labels as repeated measurements on an unchanged scale merely because the same star icons appear.
A carried-over rating and an expired rating mean different things
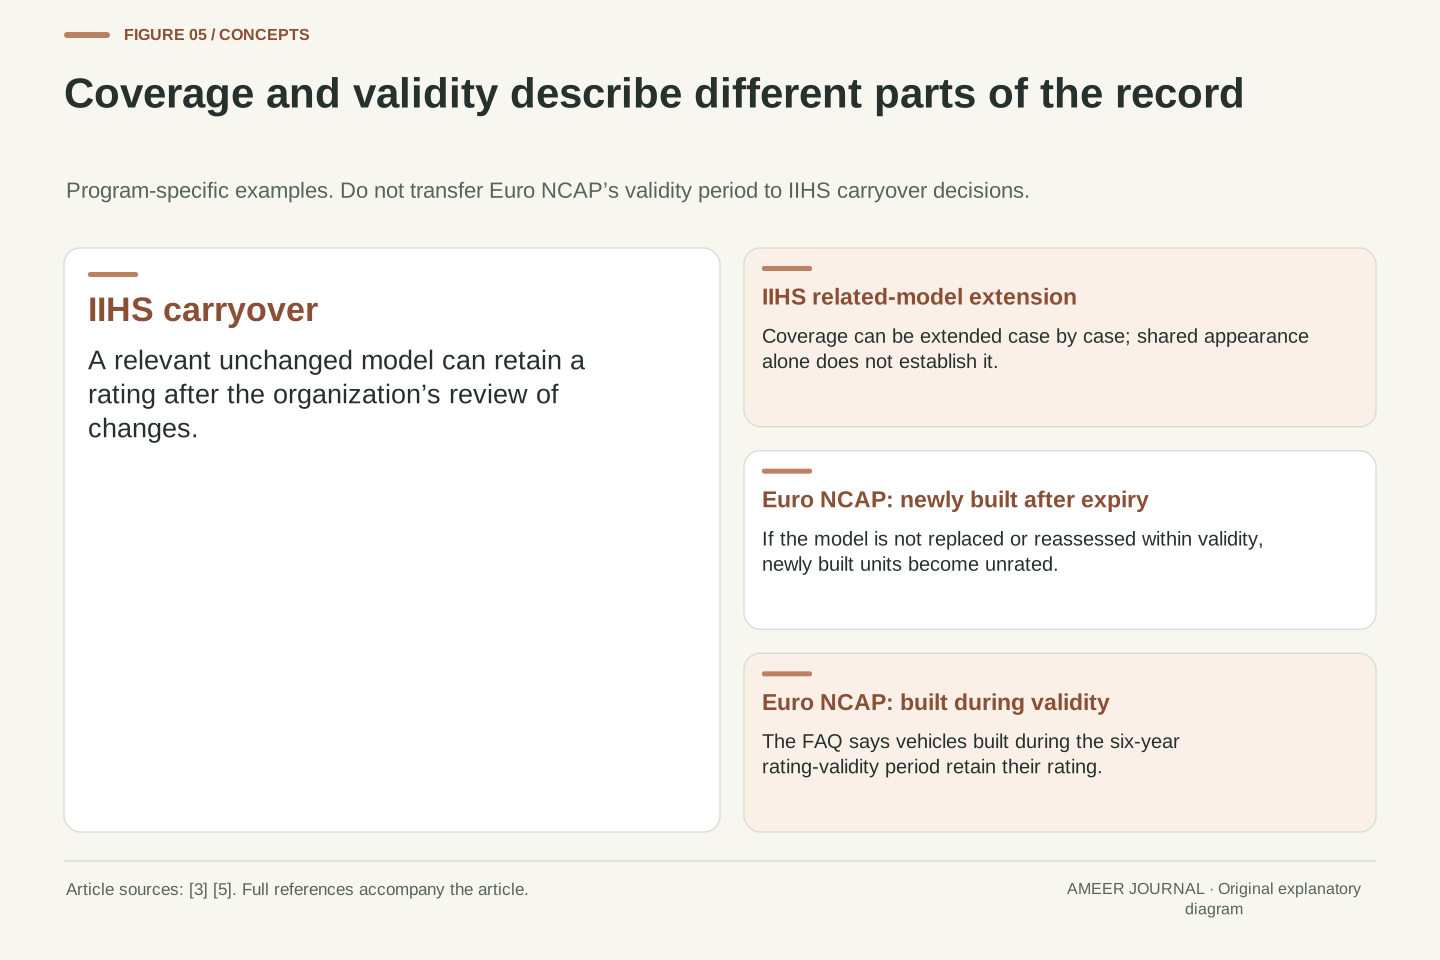
IIHS explains that it cannot retest every model every year. It examines changes that could affect performance and can carry a rating forward when relevant features are unchanged. It also describes case-by-case extensions to related models under specified conditions. A later listing therefore does not necessarily mean a new physical crash test was performed that year. The organization’s coverage decision matters. [3]
Euro NCAP describes a different question: the validity period of its rating. Its FAQ says that, if a model is not replaced or reassessed within the six-year period, newly built units become unrated when the rating expires. Vehicles built during the valid period retain their rating. That distinction prevents expiry from being read as the deletion of every earlier vehicle’s assessment. [5]
These are program-specific processes. IIHS carryover should not be described as an automatic six-year rule, and Euro NCAP’s expiry language should not be used to infer a sudden physical change in a car. A rating records an assessment and its coverage. It does not inspect the present condition of an individual used vehicle. Likewise, consumers cannot extend a rating themselves merely because two cars look unchanged.
Rating coverage can persist without a newly executed test. IIHS describes reviewing changes to structure, airbags and other relevant features, carrying results forward when appropriate, and considering related-model extensions case by case. It also distinguishes its own tests from eligible manufacturer-supplied test data. [3] The correct provenance is the organization’s record, not an assumption that each model-year listing corresponds to a new IIHS crash.
Euro NCAP’s validity rule addresses another dimension. Under its FAQ, expiry after the six-year validity period changes the status of newly built units to unrated if the model has not been replaced or reassessed; units built during the valid period retain the rating. [5] This condition distinguishes the applicability of a historical assessment from eligibility to carry it indefinitely into new production.
Do not merge these two mechanisms into a universal policy. A carryover decision is scoped to the issuing program and vehicle changes, while expiry is scoped to the named validity system. Neither establishes the current physical condition of an individual vehicle. The absence of a newly performed test also does not invalidate an officially covered carried-over result. Both overstatement and dismissal are avoided by retaining the actual coverage and provenance notes.
Read an absent result and a safety concern separately
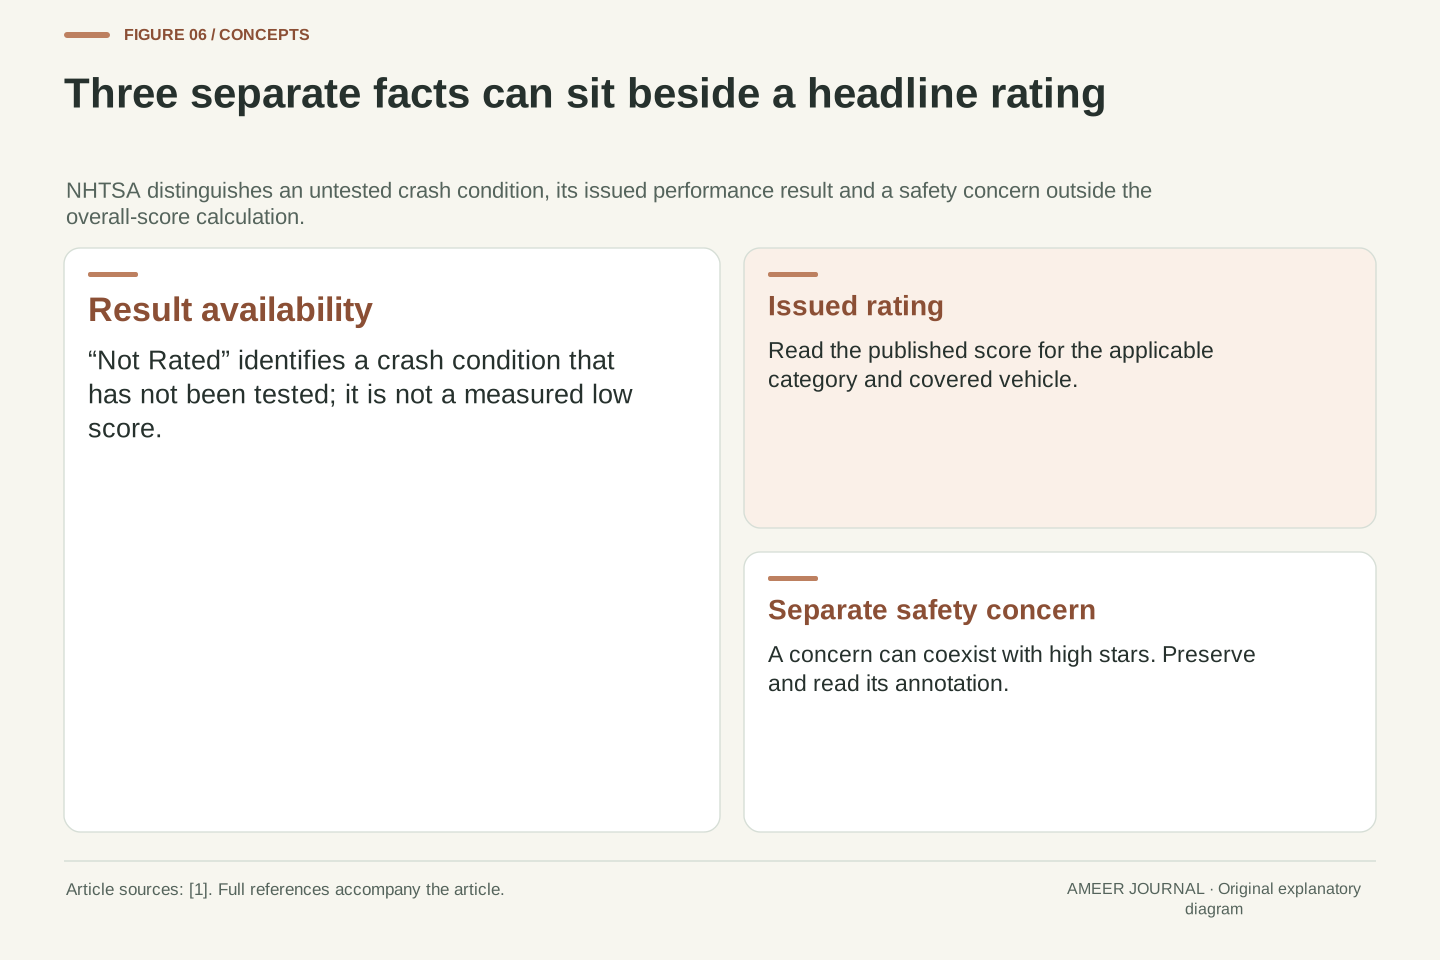
NHTSA says “Not Rated” appears when a vehicle has not been tested for a particular crash condition. That is different from receiving a low result in a completed assessment. Treating missing evidence as the lowest score invents a measurement; treating it as a reassuring result invents one too. Read the category attached to the absence rather than assuming the whole vehicle has one uniform status. [1]
A separate warning symbol can identify a safety concern. NHTSA says these concerns are not included in the calculation of its Overall Vehicle Score, so a vehicle can have high stars and still carry a concern. The notes may identify an issue such as a component’s unintended performance. The headline does not cancel that separate record. [1]
A practical reading order is to open the category, read whether a result exists, then inspect its score and any concern note. These are separate facts. If an advertisement shows only the stars, return to the official record before drawing the broader conclusion. A complete explanation can include both a favourable calculated score and a relevant concern without contradiction, because the organization explicitly records them through different channels.
Missingness, measured performance and a separately flagged concern are distinct states. NHTSA defines “Not Rated” for a crash condition that has not been tested. It does not assign that absence the numerical meaning of a low star result. [1] Substituting a low or high value would create information that the record does not contain and could distort a comparison.
NHTSA also states that safety concerns are outside the calculation of the Overall Vehicle Score and can coexist with a high rating. The warning is placed in the relevant crash category and overall-score area. [1] Consequently, the overall label and concern field are not redundant encodings of the same quantity. Reading only the scalar summary discards a separate dimension of the evidence.
An interpretation should therefore preserve result availability, the issued score and the concern annotation independently. This is especially important when extracting ratings into a comparison table: an empty result must remain distinguishable from a low result, and a concern must survive the formatting step. No invented penalty or bonus is needed. The reader needs the published score together with its original qualification, rather than a replacement composite that conceals how it was constructed.
Turn a headline into a question the evidence can answer
Return to the fictional 3,200-pound passenger car. A question such as “Which listing has more stars?” is incomplete. A better version identifies NHTSA frontal or Overall Vehicle Scores, compares a passenger car within the stated weight difference, and checks that both records apply to the vehicles being discussed. Only then do the stars become part of the answer. The class and weight conditions are the program’s rule; the fictional weights simply make the logic visible. [1]
For a Euro NCAP comparison, keep the assessment year and standard or optional-pack specification attached. For an IIHS moderate overlap question, retain the test version and relevant occupant position. The task is not to force every organization into one ranking. It is to find the relevant evidence and compare it on terms that preserve its meaning. [2][3][4][5]
Save the source record with the question it answers: issuer, covered vehicle, requirements, category, result and notes. If a crucial field is missing, identify that gap instead of filling it from an advertisement or a similarly named vehicle. A well-read safety rating remains valuable because its limits are visible. It tells you how the assessed vehicle performed within a documented system, while leaving the next, different question clearly marked for its own evidence.
A defensible comparison starts by declaring the estimand in plain language: which reported outcome is being compared, for which covered vehicles, under which assessment conditions? In the fictional NHTSA example, frontal or overall eligibility requires the shared class and bounded weight difference before the results are interpreted. [1] This is a filtering step on applicable records, not a new safety metric.
The same method accommodates different programs without inventing cross-program equivalence. Euro NCAP comparisons retain requirement year and equipment configuration; IIHS moderate overlap interpretation retains the version, relevant occupant evidence and official coverage. [2][3][4][5] Component questions can then be investigated directly instead of being answered by an overall label whose aggregation includes other domains.
Keep the published record and its qualifications together when saving or sharing the conclusion. If configuration, test identity or coverage is unknown, state which inference remains unresolved. An issued rating is useful evidence, but its meaning depends on the measurement framework and subject identity that produced it. Preserving those fields supports an auditable comparison and prevents a correct number from becoming an unsupported claim through lost context.
Sources & further reading
Explore the references behind this guide. External pages may change after our review.
- Car Safety Ratings | Vehicles, Car Seats, Tires | NHTSAU.S. National Highway Traffic Safety Administration · Accessed 7 Nov 2026
- Moderate overlap frontInsurance Institute for Highway Safety · Accessed 7 Nov 2026
- About our testsInsurance Institute for Highway Safety · Accessed 7 Nov 2026
- Euro NCAP | The stars explained | Euro NCAP assessment areasEuro NCAP · Accessed 7 Nov 2026
- Euro NCAP | FAQs | Your car safety questions answeredEuro NCAP · Accessed 7 Nov 2026
Article updated 7 Nov 2026.
Found something we should revisit?
Good explanations get better with thoughtful feedback.