What you’ll take away
- Regeneration recovers some available mechanical braking energy; it does not reverse every energy use on a journey.
- State whether a recovery amount is measured at the machine, battery terminals or stored battery energy.
- Speed enters translational kinetic energy as a square; a power limit adds a separate time-dependent constraint.
- One-pedal control and familiar deceleration do not prove a particular energy return or guarantee an adequate stop.
- A meaningful percentage needs its denominator, operating conditions and measurement interval.
Recovering a stop is different from recovering a journey
A car slows down, its energy meter turns toward charging, and some energy returns to the battery. It is tempting to imagine that everything used to reach that point is coming back. Regenerative braking has a narrower job: the electric drive captures some mechanical energy while slowing the vehicle, instead of sending all that braking energy into heat at conventional brakes. The battery is the destination, not the original source of this recovered energy. NHTSA describes both the recovery function and the continuing need for conventional braking. [2] The useful question is therefore: what energy is available at this particular moment?
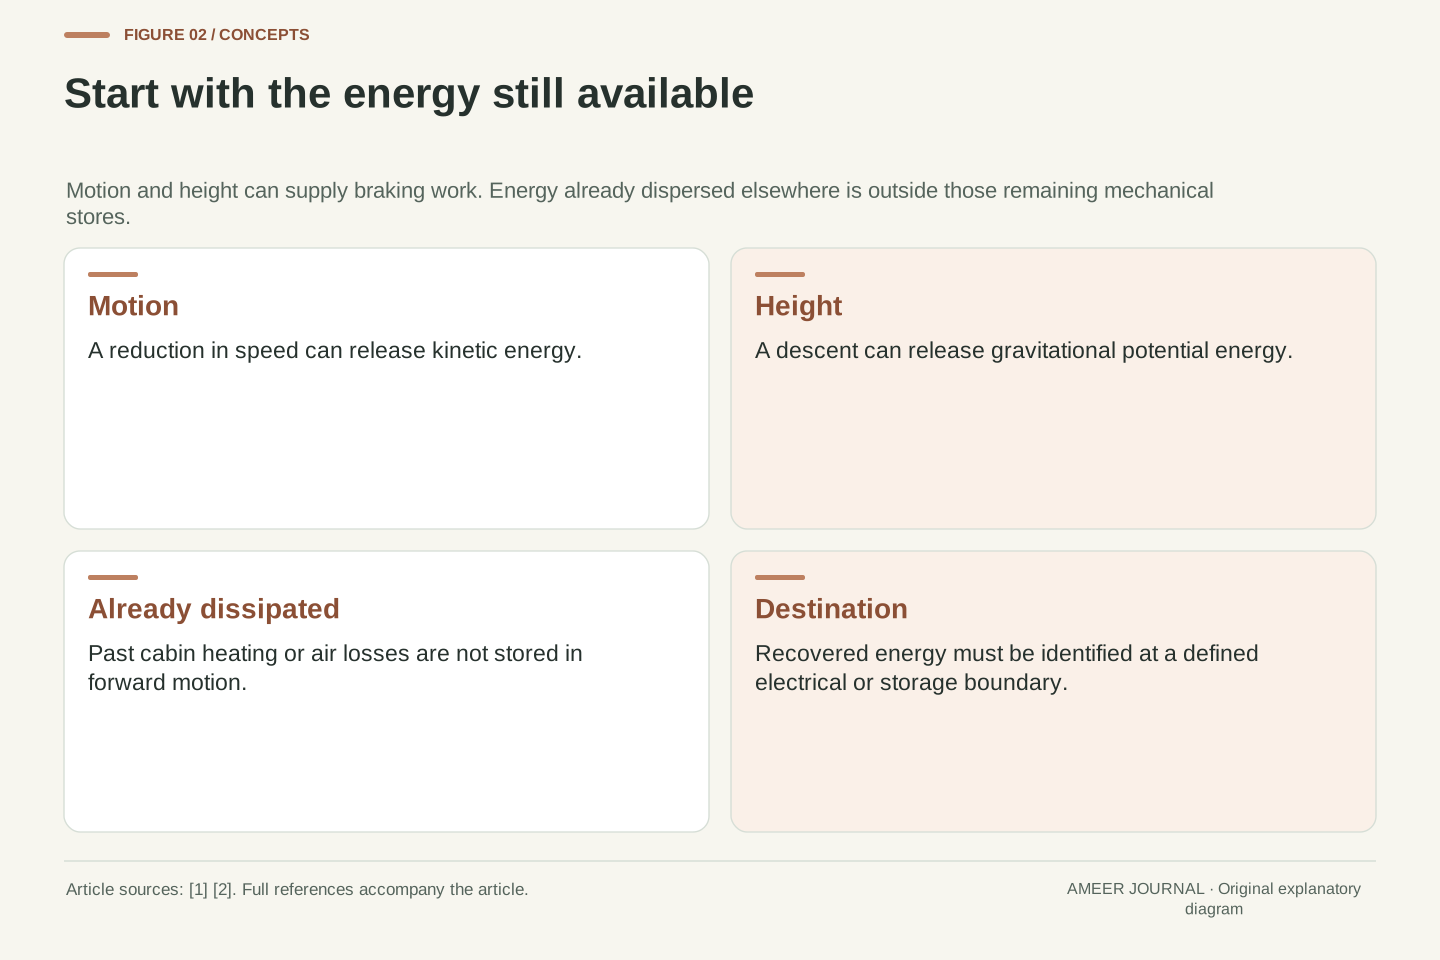
Motion is one store; height is another. A moving car has kinetic energy, and a car descending toward a lower elevation can release gravitational potential energy. Those are the starting points for the examples below. [1] Energy already spent heating the cabin or dispersed into the surrounding air is not sitting in the vehicle's forward motion waiting for the next stop. That is an energy-accounting distinction, not a claim that recovery is unhelpful. A good reading of a regeneration display separates the energy still available to the braking system from the larger amount the whole journey required. It also keeps safe stopping ahead of any recovery target.
Regenerative braking is a mechanical-to-electrical energy-recovery process, not the reversal of every energy expenditure on a route. NHTSA identifies the traction machine's generating role and distinguishes it from the conventional brakes, which remain necessary during some braking events. [2] The relevant control volume might be the vehicle's moving mechanical parts, the generator terminals, the DC bus, or the battery's stored energy. Those boundaries produce different quantities. Before interpreting a recovery percentage, identify both its numerator and its denominator. A fraction of braking work is not automatically the same fraction of traction-battery discharge, grid electricity, or total journey energy.
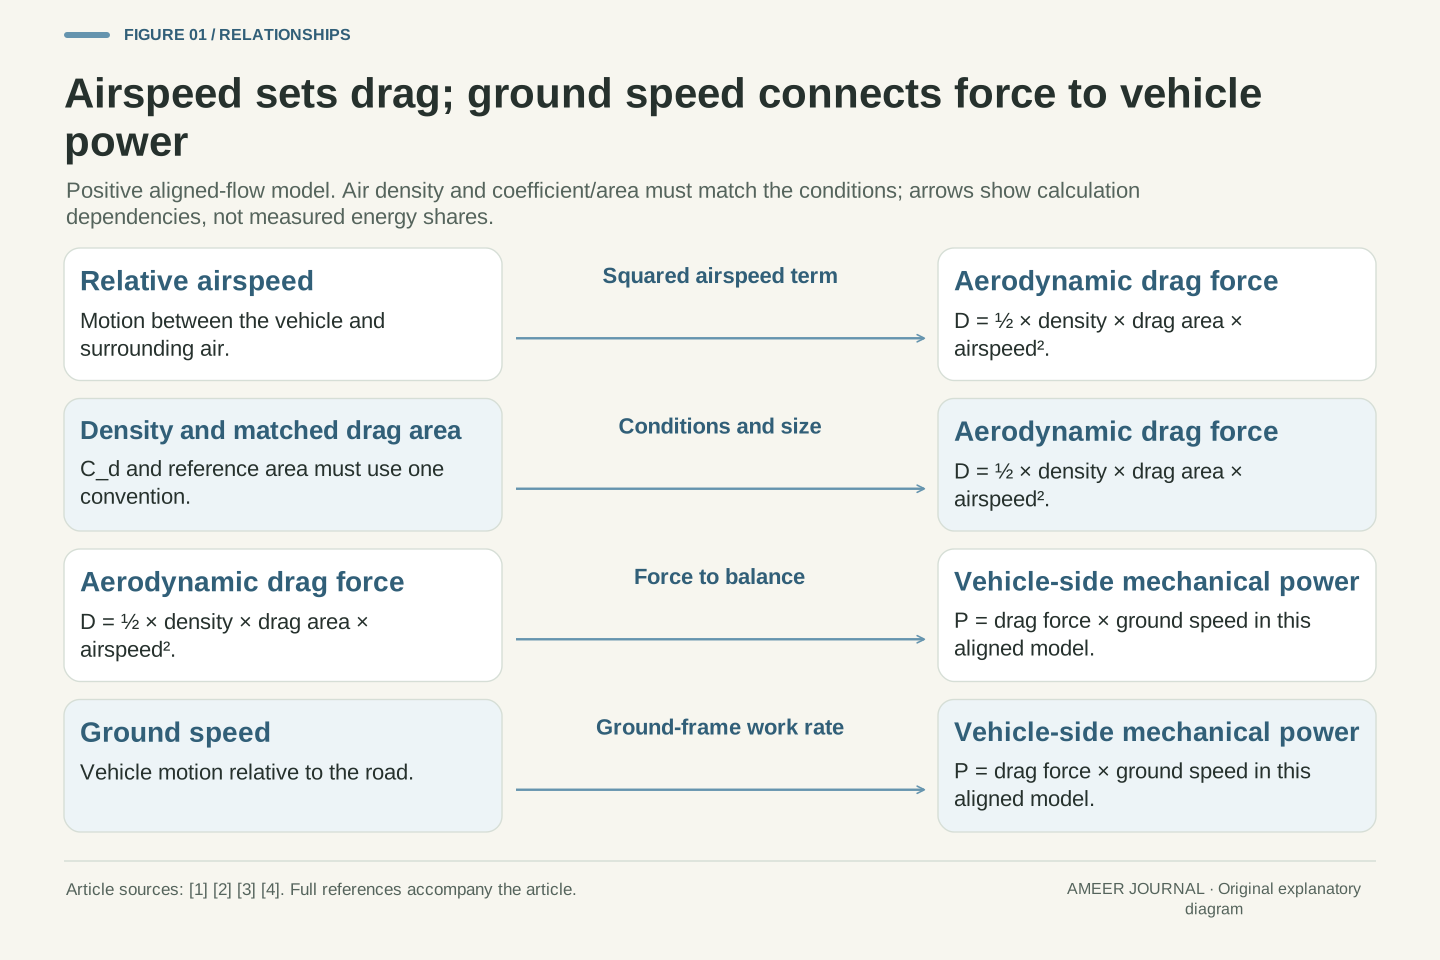
Two mechanical stores are especially useful here: translational kinetic energy, K = ½mv², and gravitational potential energy relative to a selected height reference, U = mgh. [1] Reducing speed or elevation can supply energy to the regenerative path. Previously dissipated aerodynamic work and energy already consumed by auxiliary loads are not included in the remaining K or U. This follows from the chosen accounting boundary; it does not imply that these other loads disappear during deceleration. We will use explicitly hypothetical ledgers to separate available mechanical energy, electrical recovery and net battery expenditure, without treating any assumed efficiency as a measured vehicle specification.
The motor becomes part of a return path
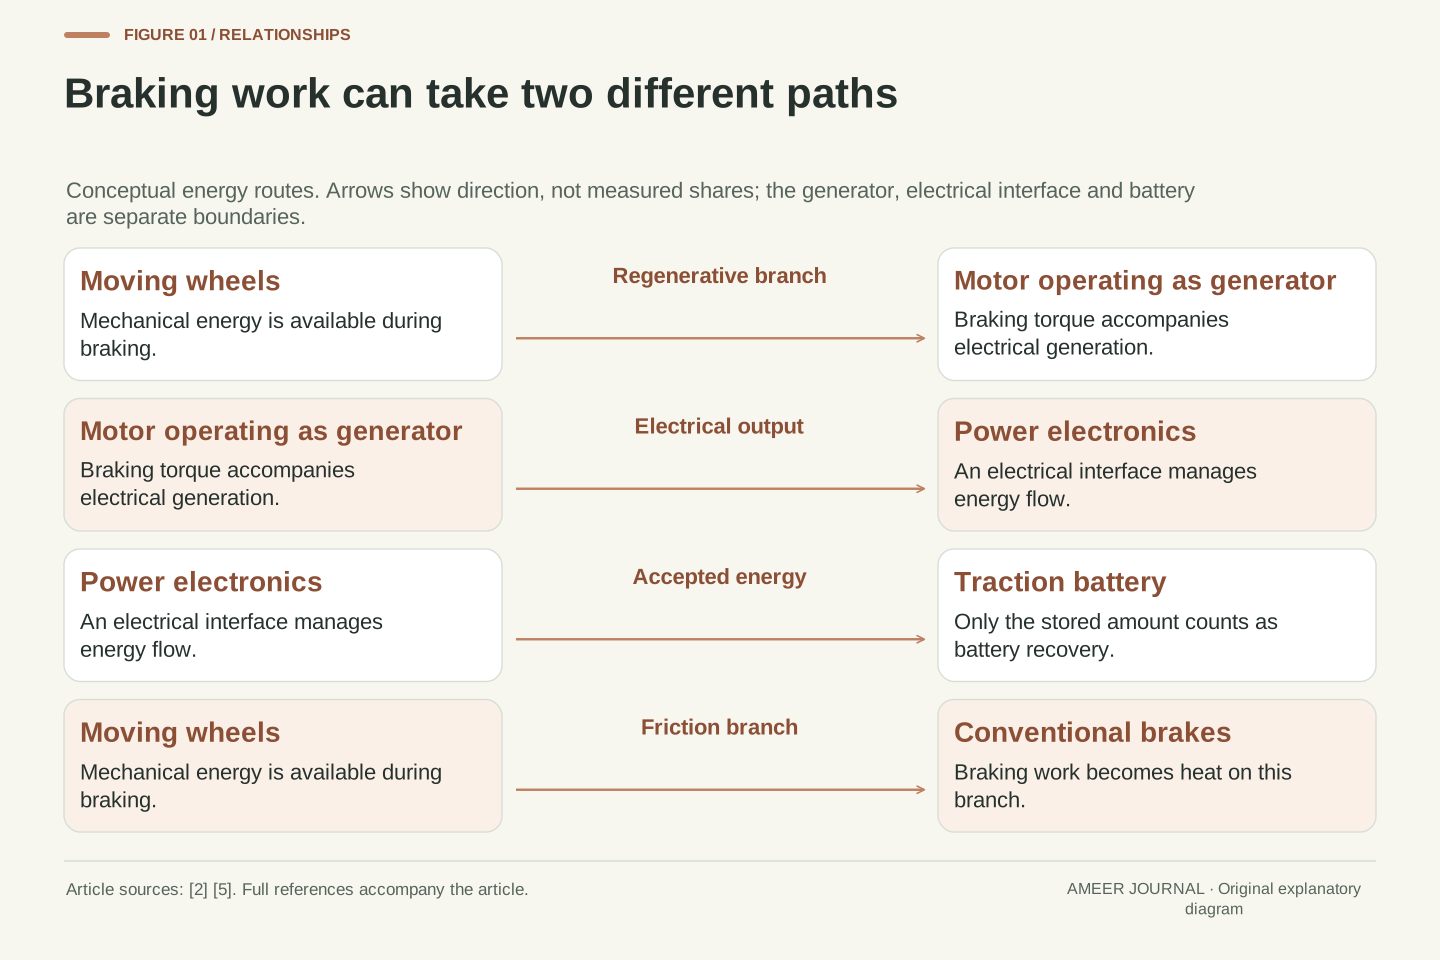
During powered driving, the battery supplies energy and the electric drive produces motion. During regeneration, the moving wheels can drive an electric machine as a generator. DOE's component guide describes electricity generated from rotating wheels during braking and transferred back to the traction battery. [5] This change is a change in the direction of energy flow; the wheels do not need to start turning backwards. The machine resists their motion while energy moves through the electrical system. That is why charging and slowing can happen together. The power electronics and battery are parts of the process, not an extra source of free energy. [2]
Conventional brakes provide another route: mechanical braking energy becomes heat instead of returning through the generating path. [2] A real slowing event can involve both routes. You cannot identify the recovered amount merely by noticing that the car slows strongly or that you have lifted your foot from the accelerator. The useful sequence is wheels, generating machine, power electronics and battery, with the amount at each boundary defined separately. A figure shown at the motor is not necessarily energy stored in the battery. The differences matter when comparing a technical claim, a dashboard number and a calculation that starts with the vehicle's speed.
In traction operation, the drive supplies positive mechanical work to the vehicle. In regeneration, the machine develops braking torque while rotational motion drives electrical generation. DOE's hybrid component description supports this general wheel-to-generator-to-traction-battery path; its combustion-engine and fueling details are not being applied to battery-electric vehicles. [5] NHTSA describes the motor/generator, inverter and traction-battery roles. [2] For an AC traction-machine architecture, the power-electronics stage provides the electrical interface between machine and battery. Reversing energy flow does not require reversing shaft rotation. The braking torque opposes the direction of motion while the vehicle continues travelling forward.
A useful accounting diagram therefore has at least two branches: mechanical work routed through the generating drive, and mechanical work dissipated by conventional braking. NHTSA explicitly retains the latter branch rather than portraying regeneration as a replacement for all conventional braking. [2] The recovered amount must specify whether it is measured at generator output, at battery terminals or as an increase in stored battery energy. Conversion losses and concurrent electrical demand can make those quantities differ. The examples here define recovery at the stored-energy boundary. They do not infer battery storage from a machine's nameplate power or assume that every braking request passes entirely through the motor.
An invented stop puts the energy in perspective
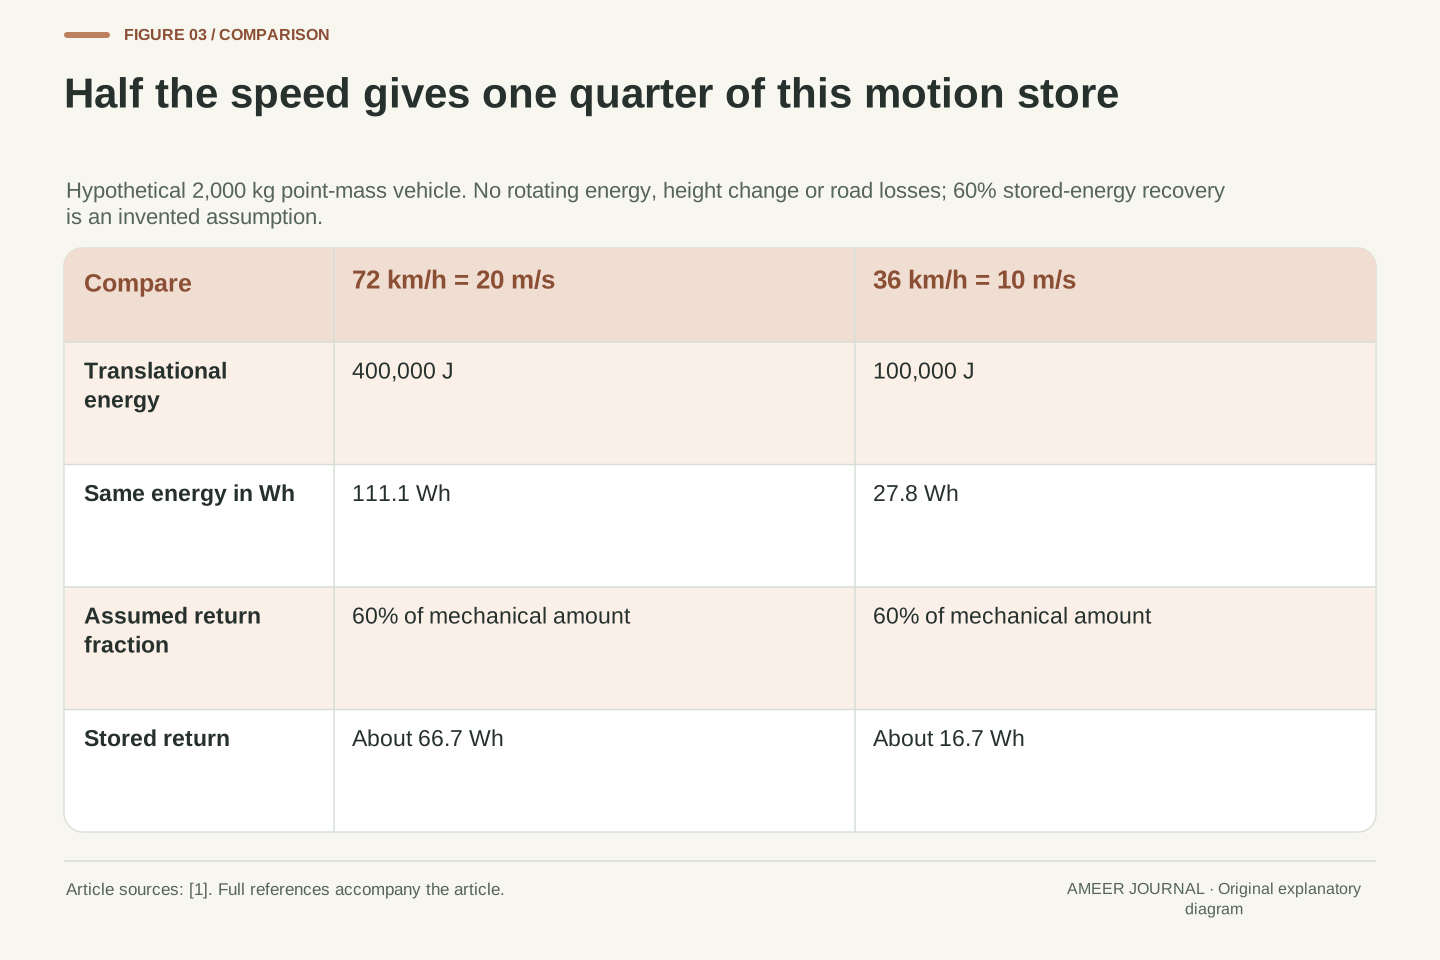
Consider a hypothetical 2,000 kg vehicle moving at 72 km/h, which is 20 metres per second. For this calculation only, count its forward motion and ignore rotating wheels, changes in height and energy lost to the road or air during the stop. The kinetic-energy rule is half the mass multiplied by speed squared. [1] That gives ½ × 2,000 × 20 × 20 = 400,000 joules. Because one watt-hour equals 3,600 joules, this is about 111.1 Wh, or 0.1111 kWh. It is the model's starting mechanical energy, not a promise that a battery will gain that amount.
Now invent a recovery assumption: 60% of that mechanical energy reaches battery storage. The returned amount is about 66.7 Wh. If the same imaginary vehicle starts at 36 km/h, or 10 metres per second, its forward-motion energy is 100,000 joules, about 27.8 Wh; the same assumed recovery fraction gives 16.7 Wh. Halving speed has quartered this store because speed is squared in the formula. [1] These are desk calculations, not suggested driving tests, and the 60% value is an input we chose. They explain why two stops need not offer equal energy even if both feel like ordinary braking events.
Use an explicitly hypothetical point-mass model: m = 2,000 kg, initial speed v = 20 m/s, final speed zero, with no elevation change, rotating inertia or road-load work. NASA's translational expression gives K = ½mv² = 400,000 J = 111.111 Wh = 0.111111 kWh. [1] The joule-to-watt-hour conversion uses 1 Wh = 3,600 J. Under these assumptions, 400 kJ is the mechanical-energy reduction assigned to braking. It is not a full vehicle simulation. Real rotating components add kinetic terms, while road-load work during deceleration can remove energy before it reaches the braking conversion path.
Define a hypothetical effective wheel-mechanical-to-stored-battery recovery factor of 0.60 for this isolated event. Then E_return = 0.60 × 111.111 Wh = 66.667 Wh. Repeating the model at 10 m/s gives K = 100,000 J = 27.778 Wh and E_return = 16.667 Wh. Thus K(10)/K(20) = ¼, as expected from the squared-speed term. [1] Holding the recovery factor fixed is an illustrative assumption, not a claim that an actual machine, battery or braking controller maintains constant efficiency across those conditions. The example isolates the size of the mechanical store before introducing the separate question of how quickly the system must handle it.
The return trip through the drivetrain has a cost
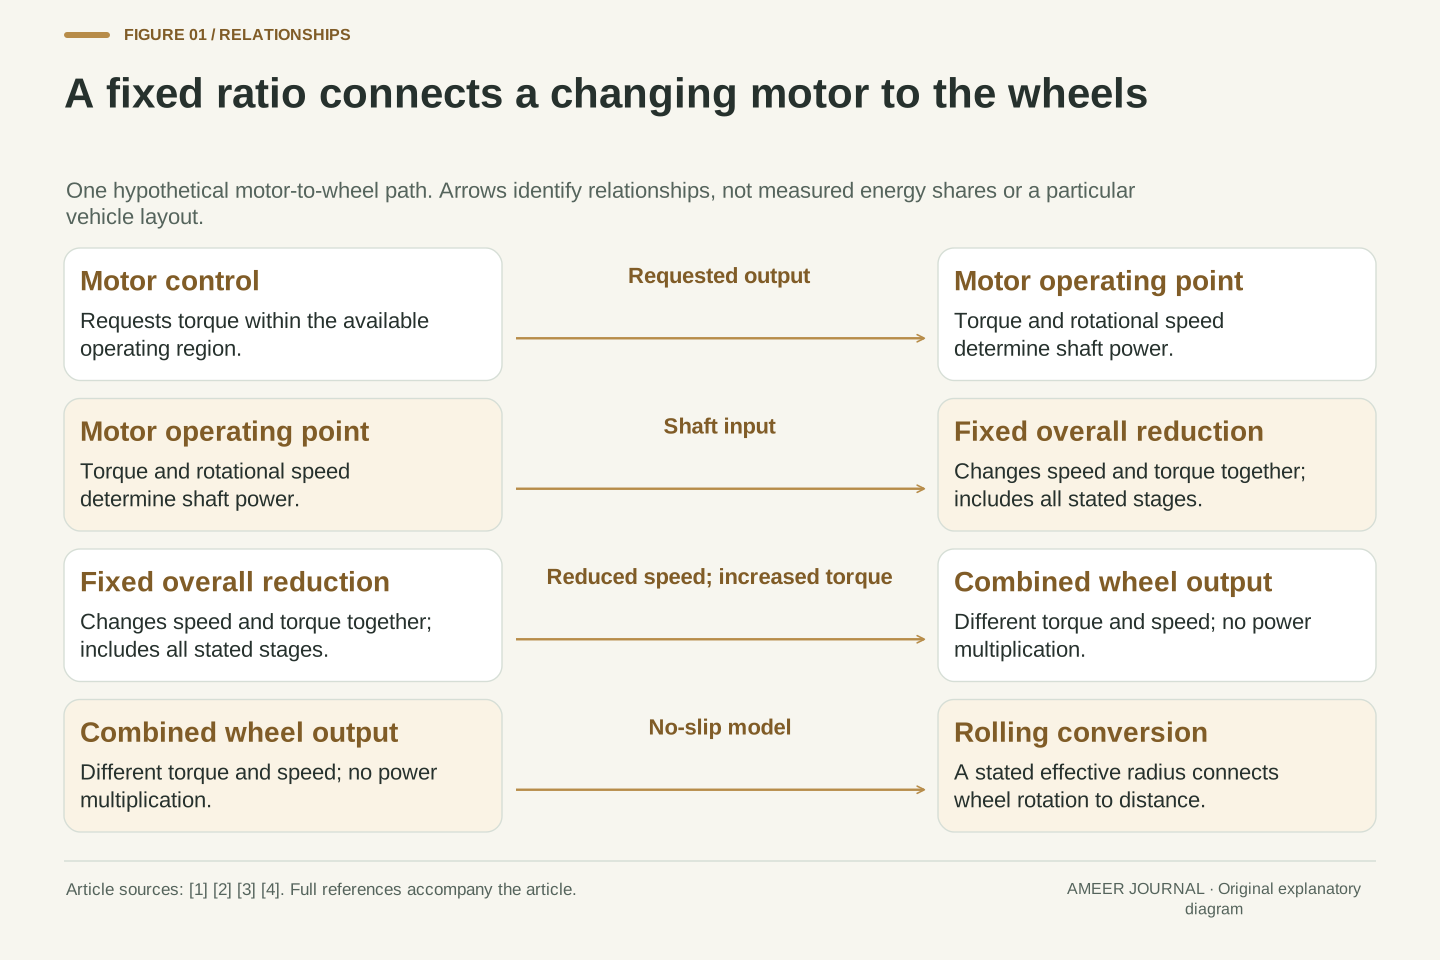
Receiving 66.7 Wh at the stop does not mean the preceding acceleration cost only 66.7 Wh. Keep the same invented 111.1 Wh motion store and make another explicit assumption: 90% of the battery energy supplied during acceleration becomes this forward-motion energy. The battery must supply about 123.5 Wh, because 111.1 divided by 0.90 is 123.5. The later stop returns about 66.7 Wh under our separate 60% assumption. The battery has therefore spent about 56.8 Wh across the two events, even before adding the road and accessory uses we deliberately excluded. Conservation of energy is the governing principle. [1]
The two percentages act in sequence. Ninety per cent followed by sixty per cent gives 54% of the original battery withdrawal returning, not 150% and not 60% of the original withdrawal. This is why repeatedly speeding up just to recover energy later cannot create a battery benefit in this model. There is no need to stage such an experiment on a road. Regeneration makes a necessary slowdown less wasteful than the all-friction version of that same slowdown. [2] It does not make avoidable speed changes free, and the numerical result changes if our invented conversion assumptions change. Always keep that distinction beside the attractive recovery number.
Extend the hypothetical point-mass event by assigning battery-to-translational-energy efficiency η_drive = 0.90. To establish K = 111.111 Wh requires E_draw = K/η_drive = 123.457 Wh. On the return path, retain η_return = 0.60, defined at stored battery energy, so E_return = 66.667 Wh. Net battery withdrawal is E_draw − E_return = 56.790 Wh. These chosen factors represent lumped conversions; they are not sourced fleet averages or measured properties of a particular EV. Conservation links the input, retained mechanical energy and losses, while the two efficiencies simply specify our hypothetical distribution. [1]
The round-trip fraction is E_return/E_draw = η_drive × η_return = 0.54. Distinguish it from η_return, whose denominator is mechanical braking energy, and from the net saving relative to an all-friction stop. If all other aspects of this model remained fixed, the latter comparison would credit the recovered 66.667 Wh. NHTSA's account establishes the physical distinction between energy capture and conventional braking heat, not these invented percentages. [2] Real journeys add nonrecoverable expenditures and changing operating conditions. A claim that cites only a large regeneration percentage without its measurement boundary cannot establish the fraction of total battery energy restored across a complete acceleration-and-braking cycle.
The same energy can arrive at a very different rate
Energy is an amount; power tells us how quickly that amount moves. Imagine removing the example's 400,000 joules of mechanical energy over two seconds. Average braking power would be 200,000 watts, or 200 kW. Spread the same amount over eight seconds and the average becomes 50 kW. These are hypothetical time windows, not braking recommendations or safe stopping distances. They show why a system can have room for an energy amount but still face a demanding rate of transfer. A battery's available space and its ability to accept power at a particular moment answer different questions. The manuals also document conditions that can reduce regeneration. [3]
Average power is not the complete shape of an event. The instantaneous value can rise and fall, and a short high-power part can exceed a limit even when the average looks modest. You therefore cannot calculate actual recovery by comparing a motor's advertised peak with our 50 kW average alone. You would need the event's changing power and the system's changing limits. The energy under that power-versus-time history is what counts. When reading a specification, keep the energy window, time window and measurement point together; otherwise a promising power number can be mistaken for an amount of energy that must return.
Power is the time rate of energy transfer. For the same illustrative 400 kJ reduction, P_average = E/Δt gives 200 kW over 2 s and 50 kW over 8 s. These calculations assign the full mechanical-energy reduction to the stated interval and do not prescribe a deceleration profile. Neither calculation supplies an instantaneous power curve. During a real stop, speed, requested torque and the permitted regenerative contribution can change. Tesla's manual confirms that battery conditions can limit available regeneration; it does not establish a universal power threshold for every EV. [3] The distinction between energy capacity and momentary acceptance is therefore essential.
Recovered energy would require integration of the accepted power over time, with the relevant conversion and storage boundary stated. If accepted battery power is measured in kW and time in hours, its integral is in kWh. A peak rating alone does not supply that integral. Nor does average mechanical braking power prove that the regenerative limit was never exceeded: a varying curve can cross a limit despite a lower average. We deliberately do not infer recovery from an invented constant cap applied to these averages. That would add a hidden time-profile assumption and make the result appear more specific than the evidence or the simple model permits.
Available regeneration and required braking are separate
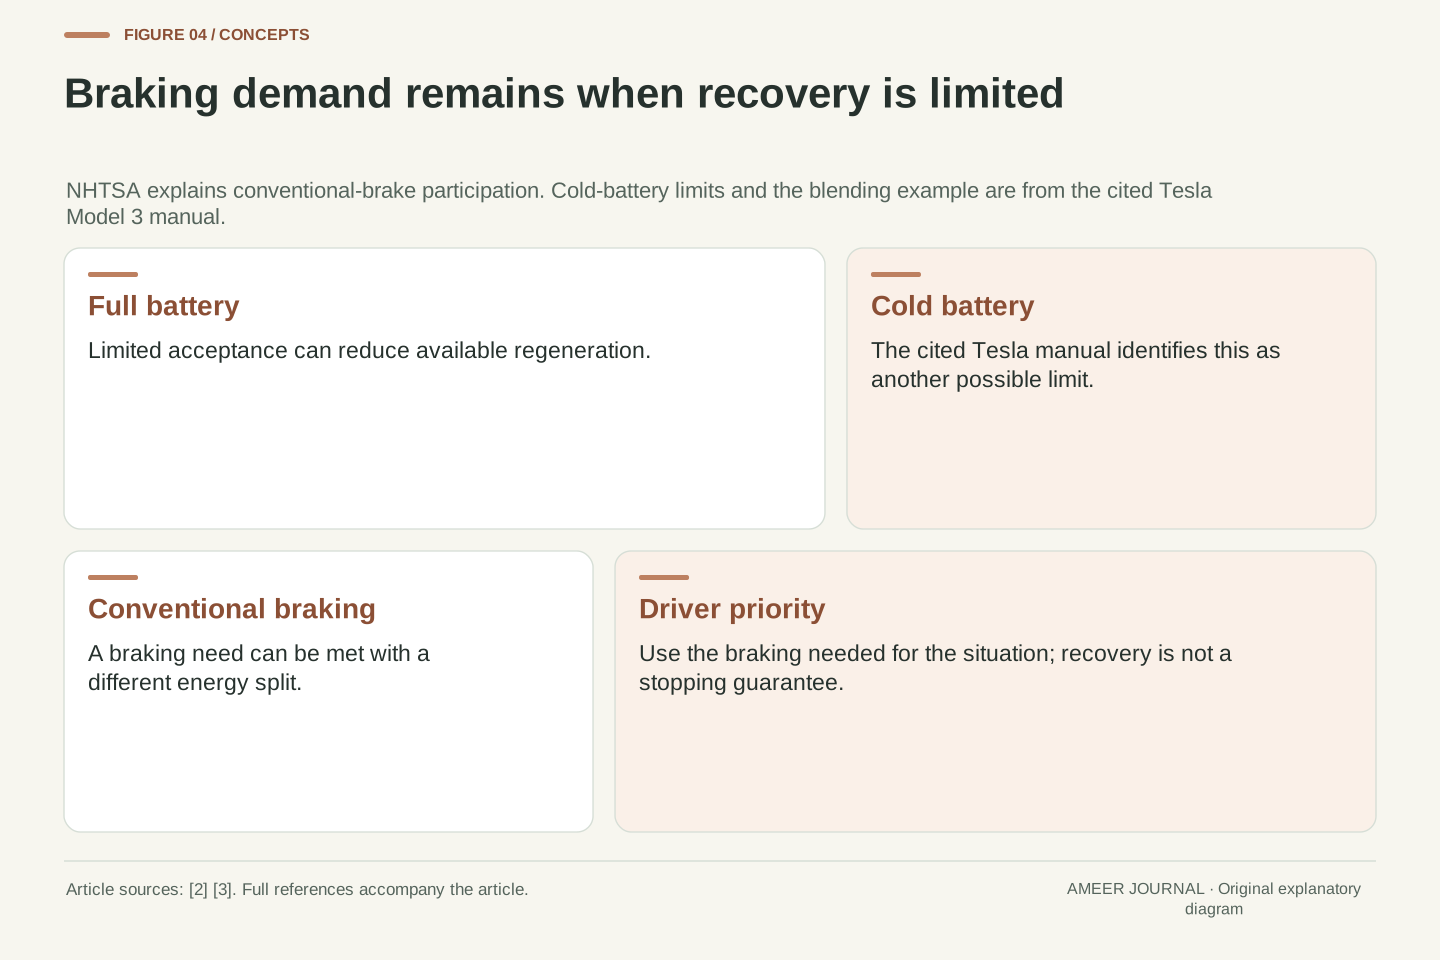
The need to slow down does not disappear when recovery becomes limited. NHTSA notes that conventional brakes still take part in events such as emergency braking or braking with a fully charged battery. [2] Tesla's cited Model 3 manual also identifies cold or full battery conditions as possible limits on regeneration. [3] These examples explain the distinction between a braking need and a battery's willingness to receive energy. They do not provide one limit or one setting that applies to every vehicle. A car's own manual and its current warning messages are the right references for its particular behaviour.
The driver's experience can also hide the energy split. The cited Tesla manual describes a setting that can engage regular brakes when regeneration is limited, subject to stated conditions. [3] Similar-feeling deceleration would then not prove identical battery recovery. Conversely, a different feeling should not be treated as a target to overcome by chasing a stronger recovery display. The practical priority is adequate braking for the traffic, surface and situation. A warning or unexpected behaviour needs attention under the vehicle's instructions; this article is not a brake diagnosis. Regeneration is an energy feature within a braking system, not permission to ignore the brake pedal or the condition of the conventional brakes.
Requested deceleration and permitted regenerative torque are different control quantities. NHTSA describes conventional-brake participation during events including emergency braking and a fully charged traction battery. [2] The cited Tesla Model 3 documentation adds cold-battery and full-battery limitations. [3] Those statements support conditional availability, not a common numerical acceptance curve across all vehicles. The battery-side limit is only part of the real control problem; the resulting deceleration must remain appropriate to vehicle and road conditions. We do not assign a universal threshold or infer a specific manufacturer's torque allocation from a generic energy diagram.
Blending can maintain deceleration while changing where the braking energy goes. Tesla's manual documents an optional regular-brake response when regeneration is limited and includes conditions on its operation. [3] That is a specific implementation example, not proof that all cars blend identically. It establishes why pedal feel or lift-off deceleration is not an energy meter. A wheel-braking request can be met through a different regenerative/friction allocation while a driver experiences a similar slowing effect. Energy analysis must preserve that branch distinction. Operationally, required braking and manufacturer warnings take precedence over optimizing the stored-energy fraction; an efficiency calculation cannot determine safe stopping behaviour.
One-pedal describes an interface, not a recovery guarantee
One-pedal driving describes how a driver commands acceleration and slowing through the accelerator. It does not tell you that every slowdown returns the same fraction of energy or that the vehicle will stop in every condition. Hyundai's cited 2026 i-PEDAL instructions warn that an active feature may fail to bring the vehicle to a stop in some circumstances and tell the driver to use the brake pedal when needed. [4] That example belongs to the linked manual. Different models and software can have different controls, so a familiar feature name is not enough to transfer its behaviour from one car to another.
Keep three questions separate when reading a one-pedal claim. What input does the driver make? How does the car produce the requested slowing? How much energy reaches battery storage? The first concerns the interface; the second includes the braking paths; the third needs a defined energy measurement. One answer does not automatically settle the others. The Hyundai warning makes the first distinction practical rather than theoretical. [4] Read the model-specific stopping limitations before relying on the feature. There is no need to test those limits deliberately, and a desire to improve an energy score should never decide when adequate braking is applied.
A one-pedal feature is a mapping from accelerator input and vehicle state to acceleration or deceleration requests. It is not itself a thermodynamic efficiency value. The cited Hyundai 2026 i-PEDAL page explicitly distinguishes activation from assured stopping, naming conditions in which the driver must use the brake pedal. [4] This is evidence about that documented implementation, not a universal performance specification for one-pedal systems. In particular, neither the interface label nor the selected setting reveals the accepted battery power, the friction-brake contribution, or a complete vehicle stopping envelope.
For interpretation, keep command, actuation and energy accounting separate. The driver command can request a deceleration; the implementation decides how available braking paths contribute; the final stored energy depends on the accepted regenerative work and losses. NHTSA's description of retained conventional brakes supports the need for that distinction, while Hyundai supplies a concrete stopping limitation. [2][4] Comparing modes solely by subjective deceleration therefore leaves key variables unresolved. A stronger lift-off response could be relevant to how a driver manages a journey, but it does not mathematically prove a higher recovered-energy total across different speed histories. We make no cross-vehicle ranking or recommendation to probe road-going limits.
A descent has a height budget as well as a speed budget
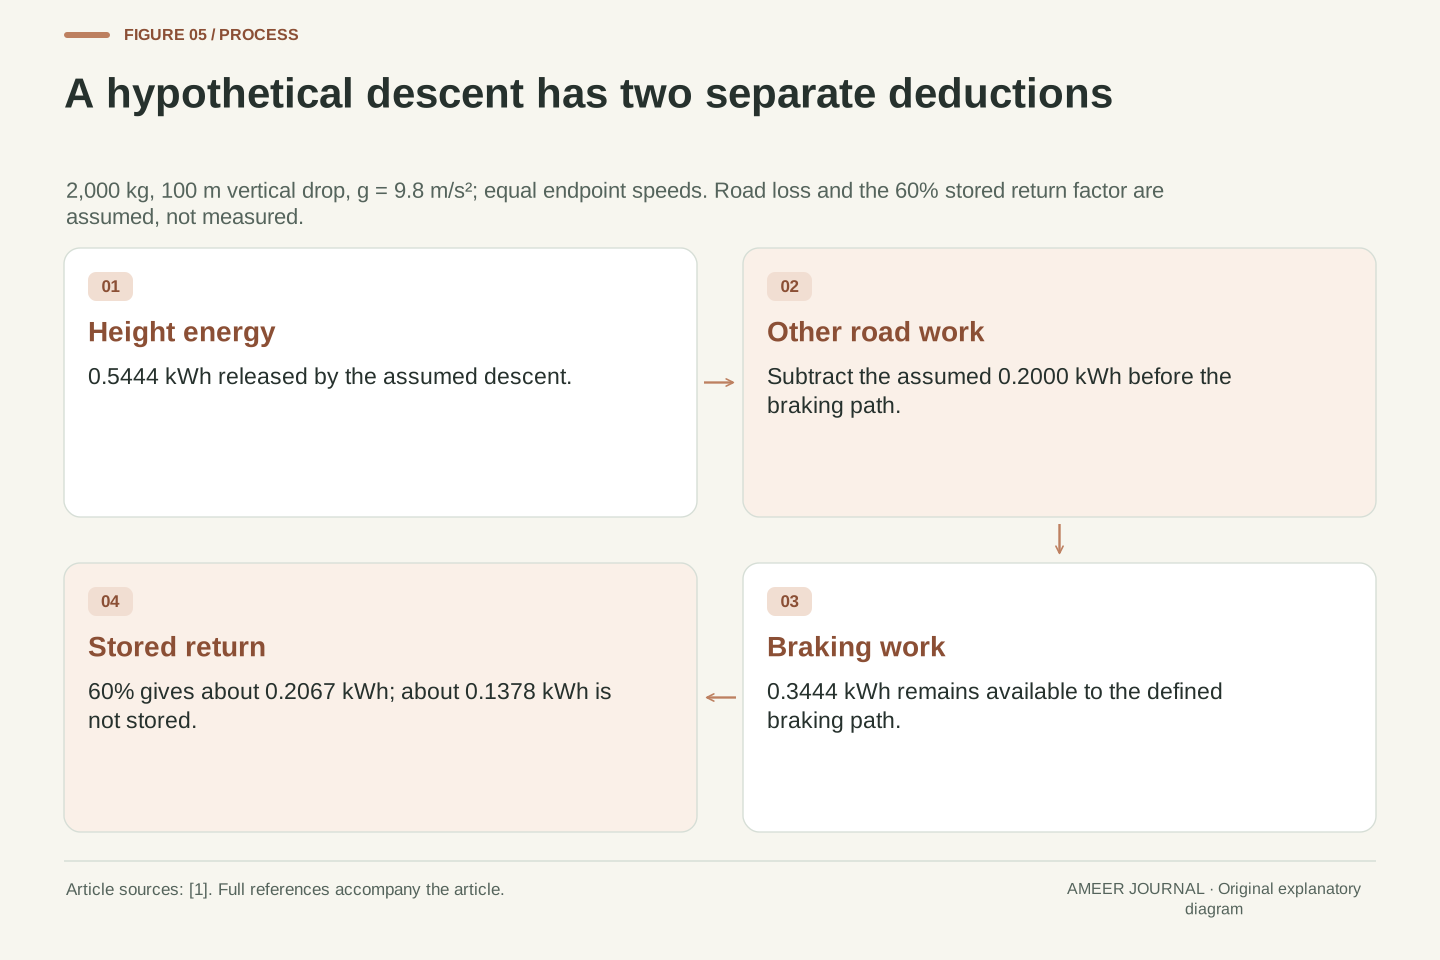
A car need not be losing speed to recover energy on a descent. Losing height can release gravitational potential energy even when starting and finishing speed are the same. [1] Take another hypothetical 2,000 kg vehicle descending through 100 metres of vertical height. Using gravity as 9.8 metres per second squared, the height-energy change is 2,000 × 9.8 × 100 = 1,960,000 joules, about 0.5444 kWh. Count vertical height, not the road's length. This is a teaching budget, not a prediction for a route, and it does not specify a safe speed, slope or driving technique.
Now suppose, purely for this example, road and air losses use 0.2000 kWh during the descent, the vehicle finishes at the same speed, and there are no other mechanical-energy changes. That leaves 0.3444 kWh for braking. If our invented 60% recovery factor applies to that remaining amount, battery storage gains about 0.2067 kWh, or 207 Wh. The rest of the braking amount is not stored. The result is smaller than the full height budget for two separate reasons: some energy never reaches the braking path, and the return path is not perfect. Height energy still has an origin; a downhill recovery display does not create energy from nowhere. [1]
For a hypothetical descent, choose m = 2,000 kg, vertical height reduction Δh = 100 m and g = 9.8 m/s². The available gravitational-potential-energy reduction is mgΔh = 1.96 MJ = 0.544444 kWh. [1] Set initial and final speeds equal, so the net translational kinetic-energy change is zero. Also exclude changes in rotating energy and other mechanical stores. The resulting energy ledger is E_potential = W_road + W_braking. This distinguishes vertical height from distance travelled along the road, and it allows generating operation without requiring a net reduction in speed between the endpoints.
Assign hypothetical road-load work W_road = 0.200000 kWh. Then W_braking = 0.344444 kWh. Applying the same stipulated effective stored-energy recovery factor of 0.60 gives E_return = 0.206667 kWh; the remaining braking-path amount is 0.137778 kWh. The ledger closes: 0.200000 + 0.206667 + 0.137778 = 0.544445 kWh, with the final micro-kWh discrepancy only from rounding. At full precision it is exact. These are assumed allocations, not measured losses or a downhill-driving recommendation. A real calculation would need actual road loads, endpoint states, electrical demands and available regenerative control; the gravitational relation alone supplies none of those additional values. [1]
A recovered-energy counter needs a denominator
Suppose an energy report says that 2 kWh was recovered. Before calling that an efficiency, ask what was measured and over which journey. Was the amount recorded at the generator, entering the battery, or estimated as stored energy? What energy amount is being used for comparison? A car might recover energy, use it again and later recover part of it again. Adding all returned amounts is a useful activity total, but it is not automatically new energy brought into the vehicle from outside. Our acceleration example shows the distinction: a real return can coexist with a net battery withdrawal.
Published efficiency figures can use a different accounting framework from our single-stop model. DOE's dated 2024 explanation reports energy-to-wheels and net regeneration terms for a specified combined city/highway cycle. [6] That context matters; it is not a universal battery-return fraction for every braking event. Do not compare its headline directly with the invented 60% used here. A worthwhile report defines the journey, the measurement boundary and whether recovered energy is counted again when reused. Without those definitions, a large total can describe energetic activity while leaving the net change in the battery or the total electricity bought unresolved.
Integrated regenerative throughput, net battery change and round-trip efficiency are different observables. A recovery counter might integrate negative traction-power events at a particular electrical boundary, while a net-energy figure combines outward and inward flows over the whole interval. Repeated reuse can contribute to throughput more than once. That is legitimate if the quantity is labelled, but it does not represent repeated external energy input. To calculate a fraction, state the reference: mechanical braking work, positive battery discharge, energy-to-wheels or grid energy. Our hypothetical η_return used only the first of these and defined the numerator as stored battery energy.
The U.S. DOE's September 2024 efficiency explanation explicitly ties its energy-to-wheels and net-regeneration figures to an EPA combined city/highway cycle. [6] It is therefore a useful example of why an accounting convention and a drive cycle belong beside a percentage. We do not adopt the headline as a current fleet guarantee or as a single-stop conversion efficiency. Nor do we translate a dashboard state-of-charge increment into an exact recovered kWh amount without a defined energy-capacity model. Compare like boundaries and intervals first; otherwise apparently inconsistent numbers may be describing different quantities rather than conflicting physical behaviour.
Use the numbers to understand the car, not to chase a score
A useful reading routine starts with the vehicle's manual: how does its regeneration behave, what limits does it describe, and when must you provide braking through the brake pedal? The cited manuals make clear that energy recovery does not guarantee an adequate stop. [3][4] Next, read the energy display's definition. Keep an amount such as Wh separate from a rate such as kW, and keep an estimate at the battery separate from the vehicle's mechanical starting energy. These are questions you can answer from documentation and existing trip records. They do not require a new braking experiment or access to high-voltage parts.
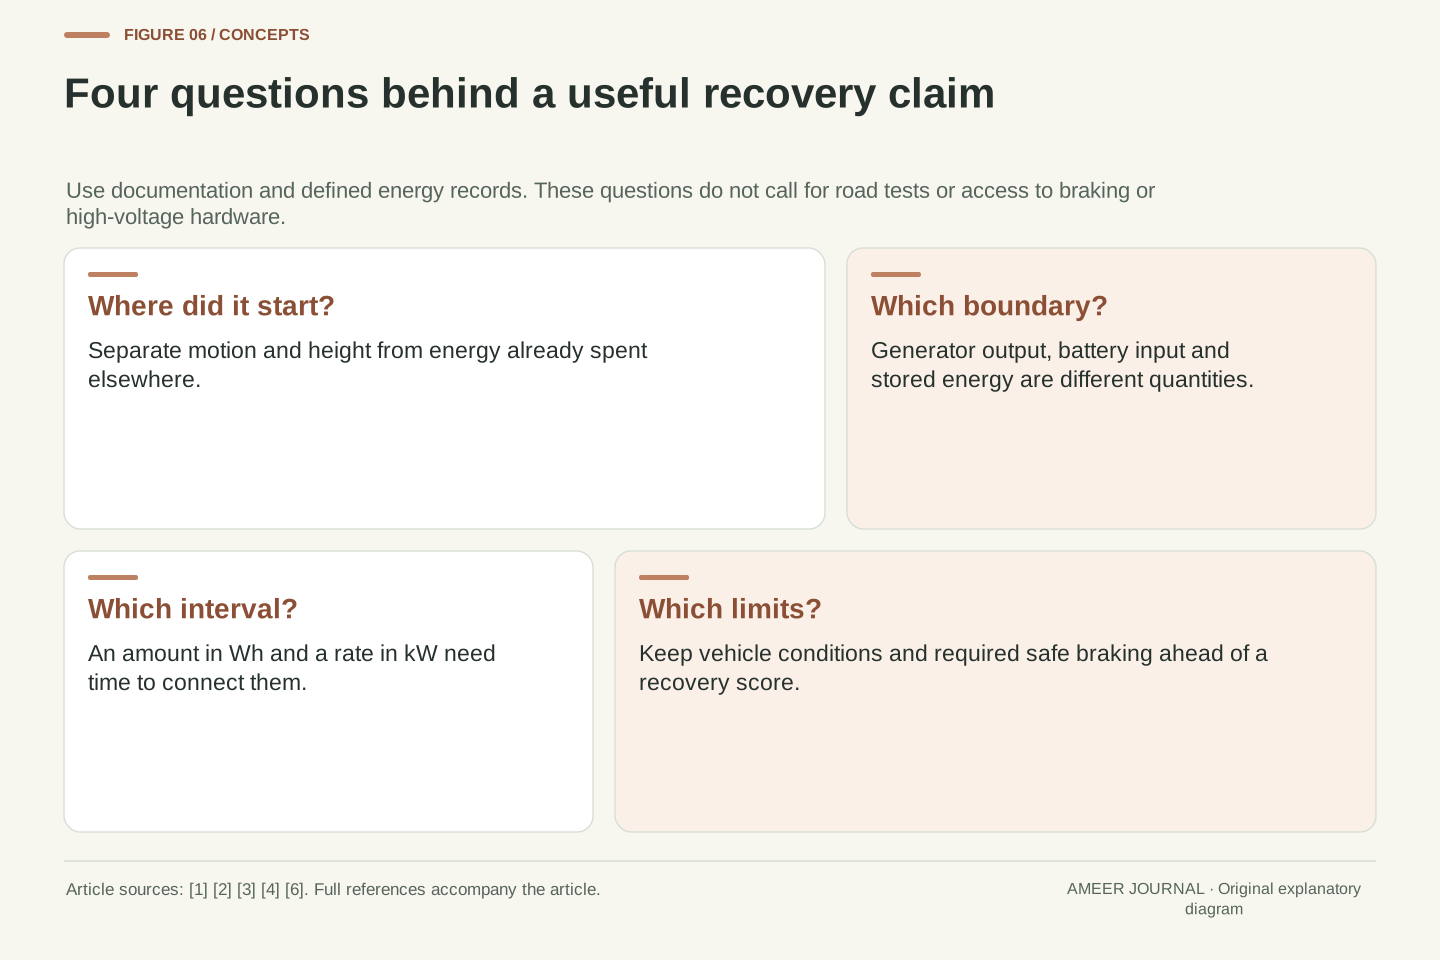
For the next recovery claim, ask where the energy came from, what was left after other losses, how quickly it arrived, and what fraction actually reached the stated destination. Those four questions explain why a descent, a gentle slowdown and an urgent stop can have different energy outcomes without any violation of physics. They also explain the value of regeneration: it can preserve some energy that a necessary conventional braking event would dissipate as heat. [2] The benefit is real, but it has a boundary. Keep the vehicle under control and apply the braking the situation requires; let the energy accounting explain the result afterward.
For a defensible interpretation, record the initial and final mechanical states, define the electrical measurement boundary, identify the time interval, and retain any stated regeneration limits. If those data are unavailable, state the uncertainty instead of substituting a peak rating or a dashboard percentage. The worked examples intentionally used known invented inputs so their energy balances could be checked. They were not calibration procedures. Model-specific manual instructions govern operation, and both cited OEM sources retain driver responsibility for adequate stopping. [3][4] No high-voltage access, brake adjustment, service procedure or deliberate road test is needed to understand the accounting.
A concise technical check is: available mechanical-energy reduction, competing work terms, power history, permitted regenerative contribution, then energy at the selected destination. That order prevents the common leap from a large kinetic or height store to an equal battery gain. It also keeps a useful technology in perspective. Regenerative braking can redirect part of necessary braking work away from frictional dissipation, while conventional braking remains part of the system. [2] Its contribution must be evaluated with explicit boundaries and operating conditions. A readable explanation should make those conditions easier to see, not replace them with an unexplained recovery percentage or an energy-score target.
Sources & further reading
Explore the references behind this guide. External pages may change after our review.
- Energy - ActivityNASA Glenn Research Center · Accessed 6 Nov 2026
- Electric and Hybrid Vehicles: Battery, Charging & Safety | NHTSAU.S. National Highway Traffic Safety Administration · Accessed 6 Nov 2026
- Braking and StoppingTesla · Accessed 6 Nov 2026
- Using i-PEDALHyundai Motor Company · Accessed 6 Nov 2026
- Alternative Fuels Data Center: How Do Hybrid Electric Cars Work?U.S. Department of Energy — Alternative Fuels Data Center · Accessed 6 Nov 2026
- FOTW #1360, Sept. 16, 2024: A Typical EV is 87%–91% Efficient Compared to 30% for a Conventional Gasoline Vehicle | Department of EnergyU.S. Department of Energy · Accessed 6 Nov 2026
Article updated 6 Nov 2026.
Found something we should revisit?
Good explanations get better with thoughtful feedback.