What you’ll take away
- A capacity-retention percentage needs its quantity, reference and comparison conditions.
- Charge retention in Ah can differ from terminal-energy retention in Wh when the voltage profile changes.
- Equal capacity does not fix resistance, voltage drop or current headroom under an operating constraint.
- Resistance and impedance results need their method, time scale and operating state.
- Present condition, future useful life and safety-related outcomes are different targets that require suitable evidence.
A capacity score does not specify every battery limit
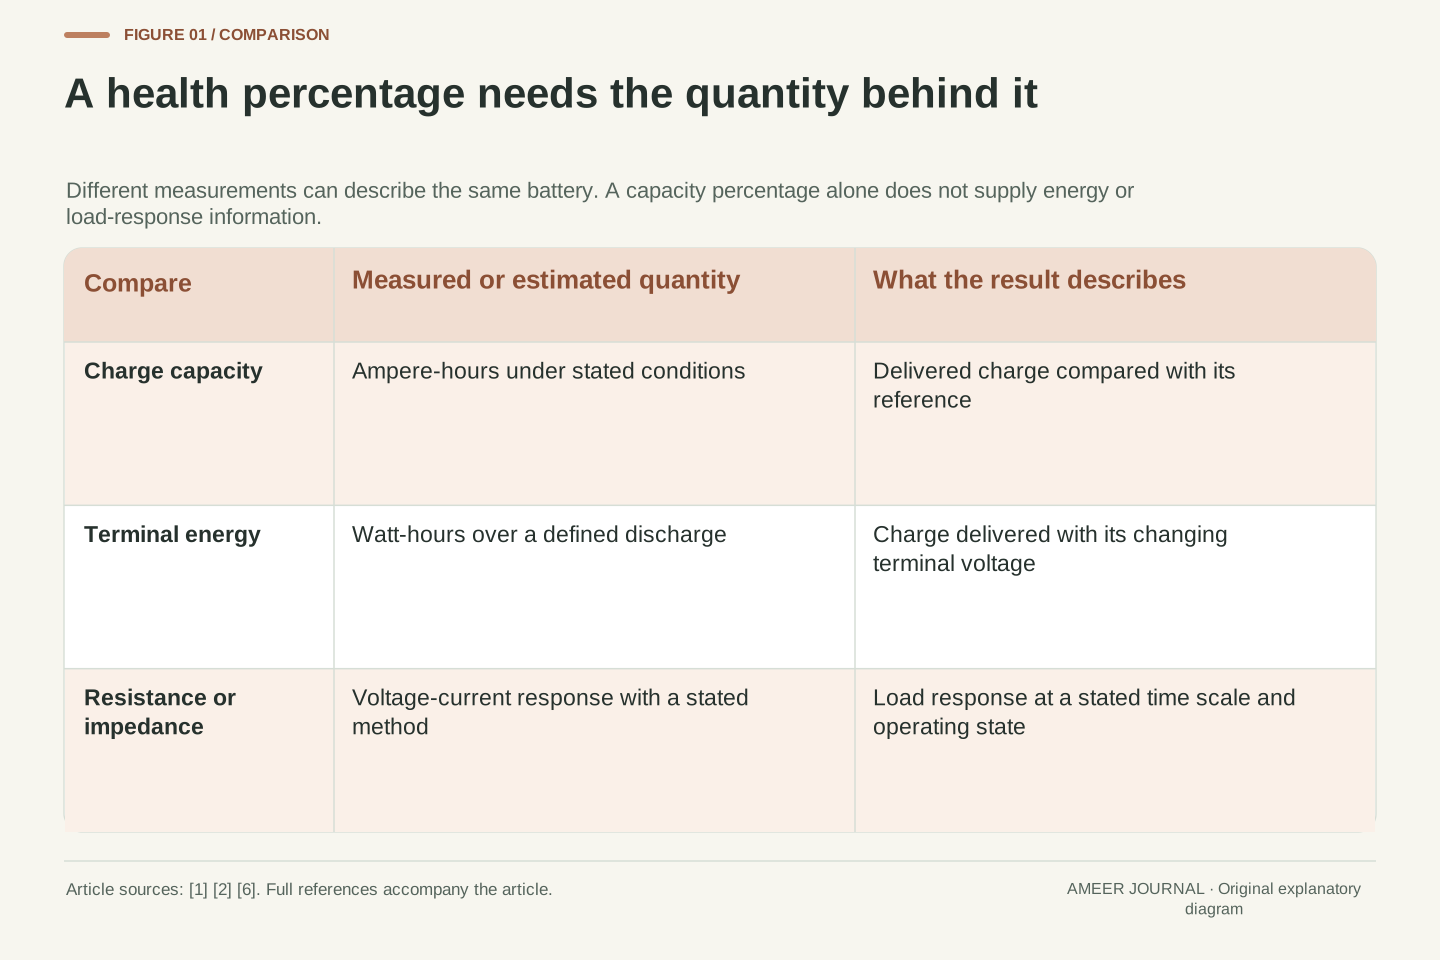
Two battery reports both say 80% health. Does that mean the batteries can deliver the same power? Only if the reports contain enough information to support that conclusion. A capacity-based score can compare the charge available under defined conditions with an earlier or rated capacity. It does not also specify every change in resistance or voltage under load. The National Academies' vehicle-technology report identifies capacity loss and impedance growth as different aspects of battery degradation [6]. They can affect what a battery can deliver in different ways.
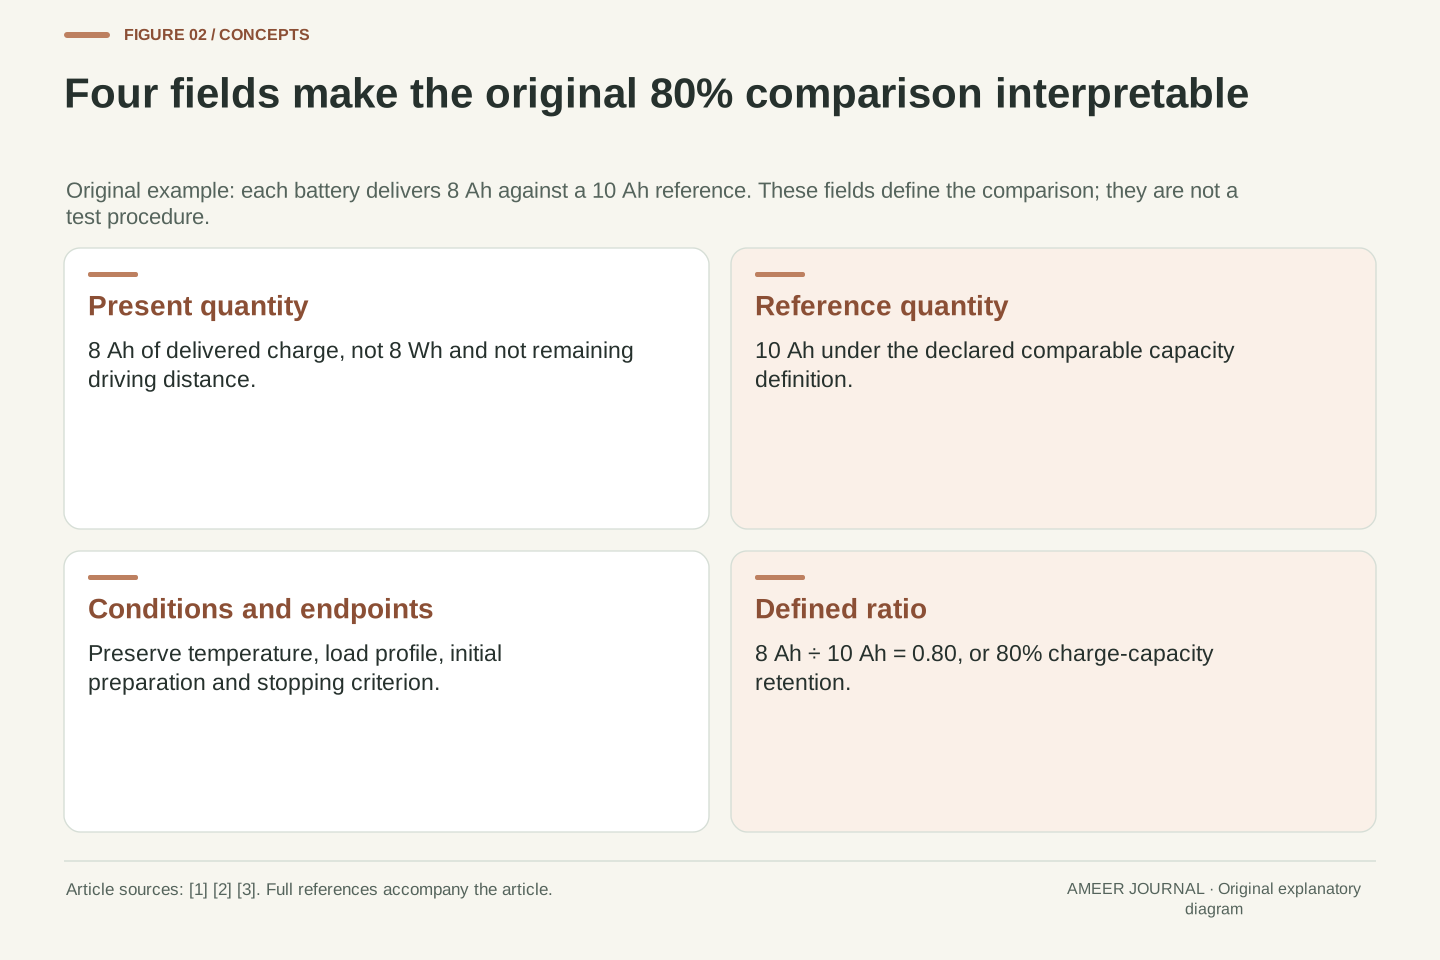
Our central example uses two invented batteries, each able to deliver 8 ampere-hours in a stated capacity comparison against a 10 ampere-hour reference. Both therefore receive an 80% capacity-retention score. Later, we give them different resistance values and ask what happens under the same load. These are analytical examples, not product tests or instructions for testing an EV pack. We will also separate charge from energy and a condition estimate from a future-life prediction. The useful habit is to read the definition behind the percentage before treating it as a complete description of the battery.
State of health is an assessment relative to a reference, and its reported scalar needs a measurand definition. Capacity-based retention, energy retention and resistance-related capability are not interchangeable. Analog Devices describes maximum releasable capacity as one health indicator, while the National Academies identifies capacity fade and impedance increase as distinct degradation measures [1][6]. A capacity score alone cannot determine a cell's terminal-voltage response to a specified load.
For an original example, define H_Q=Q_now/Q_ref with Q_now=8 Ah and Q_ref=10 Ah under declared comparable capacity conditions. Both fictional batteries A and B have H_Q=0.80. Their effective resistance parameters will differ in a separate, explicitly simplified load model. The examples contain no measured vehicle data and prescribe no battery access, cycling, pulse test or controller changes. Their purpose is to distinguish what follows mathematically from a particular health definition from what requires further evidence. A battery can have one stated capacity-retention result while its usable power also depends on state, operating constraints and voltage response.
Capacity belongs to a measurement interval and its conditions
An ampere-hour records electrical charge delivered over time. At a constant 2 amperes, four hours of discharge corresponds to 8 ampere-hours. That result needs a defined starting condition and an endpoint. It is not the amount that could be extracted by ignoring the battery's operating limits. CALCE's testing documentation describes discharge capacity in connection with specified rates and use conditions [2]. NASA's aging-dataset description likewise records different current loads and voltage endpoints, with a named capacity field tied to its particular test definition [3].
A useful capacity comparison therefore preserves more than two numbers. It states the temperature, current profile, starting preparation and stopping criterion, together with the chosen reference. A rated capacity and an actual initial measurement need not be identical; Analog Devices explicitly distinguishes them [1]. If a report divides by a nameplate rating while another divides by a measured beginning value, their percentages may answer different questions. This does not make either result automatically wrong. It means the denominator and procedure must be understood before the results are compared. The original 8/10 example assumes that those choices have already been made consistently.
For discharge current defined positive, delivered charge is Q=∫I(t)dt, expressed in Ah when time is in hours. The interval is bounded by the declared initial preparation and endpoint. With constant I=2 A over 4 h, Q=8 Ah. This arithmetic does not establish how far a real cell may be discharged. CALCE describes rate-dependent capacity characterization, and NASA's dataset documentation explicitly ties its observations to current loads, temperature and preset voltage thresholds [2][3]. Those experimental definitions are evidence about measurement scope, not a reader test protocol.
Comparable capacity retention requires compatible conditioning, temperature, load profile and endpoint criteria, plus a documented denominator. Q_ref may be a specified rating or an earlier measured capacity; the distinction matters because initial maximum releasable capacity can differ from rated capacity [1]. Mixing those references can change a percentage without any change in the present battery. Likewise, changing an endpoint can change delivered Ah without identifying an aging mechanism. A useful report preserves the observed quantity, the conditions and the reference separately. That makes H_Q interpretable as a defined comparison rather than an undocumented universal health scale.
Capacity and resistance describe related but different changes
A battery stores and releases energy through electrochemical processes. Aging can reduce the charge available within a chosen operating window. It can also change how strongly voltage falls when current is drawn. The National Academies discusses capacity loss alongside increasing impedance, and CALCE describes changes in charge-transfer and other resistance components as cells age [2][6]. These descriptions are related, but one measured number does not uniquely identify every internal change.
Consider the difference between an amount and a response. A capacity measurement asks how much charge was delivered across a specified discharge. A resistance-related measurement asks how voltage responded to a change or variation in current, with its own timing and conditions. Two batteries can agree on the first question while differing on the second. A single resistance value also does not reveal all the chemical causes behind it. That is why a richer health report can contain several indicators rather than compressing them into an unexplained average. The indicators become useful when each keeps its definition and when their relationship to the intended load is made explicit.
Degradation is not one parameter with several interchangeable units. Loss of accessible charge and changes in impedance can coexist, while their relative evolution depends on the cell and conditions. CALCE describes aging-related changes in charge-transfer resistance and possible ohmic changes associated with lost connectivity or current-collector degradation [2]. The National Academies separately discusses capacity and impedance as health-related measures in vehicle batteries [6]. Neither source establishes a universal one-to-one mapping from a resistance observation to remaining charge capacity.
A capacity result integrates delivered current over a defined interval. An impedance or pulse-response result characterizes the voltage-current relationship over a defined time or frequency range. The observables therefore answer different questions, even when both respond to aging. A real cell can require several model parameters to represent them, and an apparent change in one parameter can also depend on operating state. For the worked example, equal 8 Ah capacities deliberately leave the resistance unspecified. Assigning different effective resistances is logically consistent with that limited information; it does not claim that capacity and resistance are physically independent in every aging process.
Eight ampere-hours do not always mean the same watt-hours
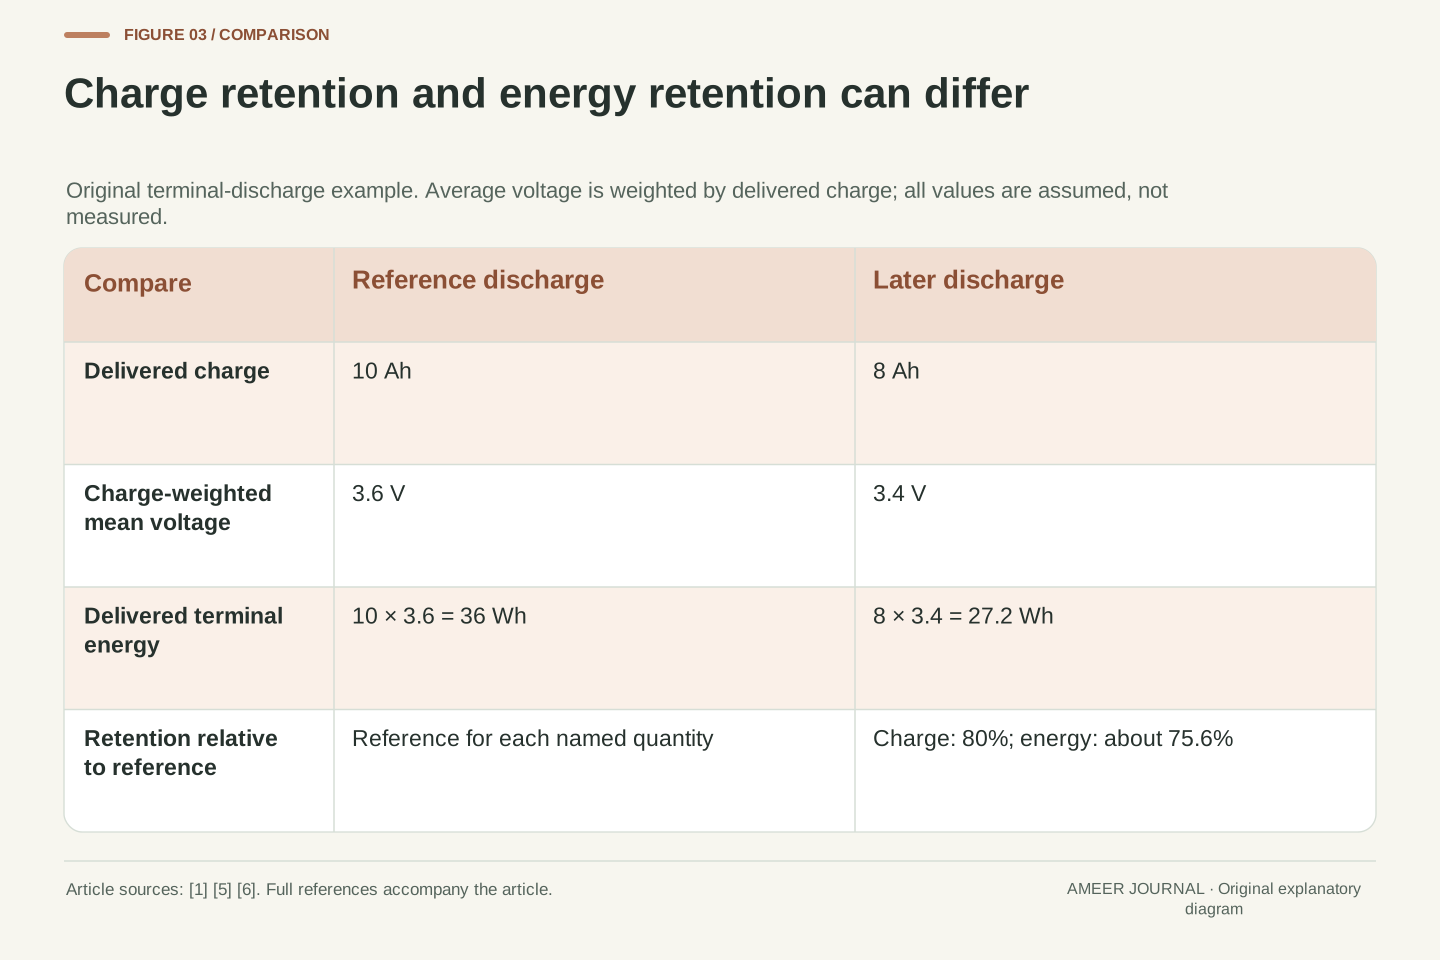
Charge and energy need different ledgers. Imagine a reference discharge that delivers 10 Ah with a charge-weighted average terminal voltage of 3.6 V. Its delivered energy is 10×3.6=36 Wh. An invented later discharge delivers 8 Ah at an average of 3.4 V, giving 8×3.4=27.2 Wh. Charge retention is 8/10=80%, while energy retention is 27.2/36, or about 75.6%. Both statements describe the supplied example correctly.
The difference comes from the voltage attached to the delivered charge, not from an arithmetic error. Each small amount of charge transfers energy at the terminal voltage present at that time. For constant current, a time-average voltage gives the same average needed here; for changing current, a simple unweighted average of voltage samples need not do so. The source discussions distinguish available capacity, voltage behavior and energy delivery [1][5][6]. Our numerical profiles are invented to make that boundary visible. They do not include charger losses or vehicle driving consumption. Before comparing a battery-health percentage with an energy figure, ask whether both refer to charge, terminal energy or some wider system boundary.
Terminal discharge energy is E=∫V(t)I(t)dt. Define the charge-weighted mean voltage V_bar=E/Q for a nonzero delivered charge Q. Then E=Q V_bar; this is an exact definition of that weighted average, not an assumption that voltage is constant. In the original example, Q_ref=10 Ah and V_bar,ref=3.6 V give E_ref=36 Wh. Q_now=8 Ah and V_bar,now=3.4 V give E_now=27.2 Wh. Thus H_Q=0.80, whereas H_E=27.2/36≈0.7556.
The retention relation is H_E=H_Q×(V_bar,now/V_bar,ref), with both discharges defined at the same terminal-energy boundary. Different voltage profiles can therefore separate charge retention from energy retention. At constant current, the charge weighting reduces to ordinary time weighting; otherwise the current profile matters. Capacity, voltage response and energy availability are distinct in the cited technical descriptions [1][5][6]. No wall-energy or range calculation follows directly from these numbers. Neither does multiplying Ah by an arbitrary nominal voltage reproduce an actual integral unless that voltage is a justified approximation for the comparison being made.
Give the two equal-capacity batteries the same load
Now return to fictional batteries A and B, both with the 8 Ah capacity result. At the moment we compare them, assume both have an open-circuit model voltage of 3.8 V. Use a deliberately simple model in which terminal voltage equals that value minus current multiplied by an effective resistance. Give A a resistance of 0.03 ohm and B a resistance of 0.06 ohm. Technical battery descriptions use resistance and more detailed dynamic models to explain voltage response [1][2][5].
At an assumed 10 A discharge, A loses 10×0.03=0.3 V across its model resistance and delivers 3.5 V at its terminals. B loses 0.6 V and delivers 3.2 V. Their terminal powers are therefore 35 W and 32 W. The resistor losses in this model are 3 W and 6 W. Equal capacity scores did not produce equal loaded voltages or losses. This snapshot holds the model voltage, current and conditions fixed. It does not say the voltage stays constant through a whole discharge, or that one resistor captures every process in a real EV battery.
Use a local equivalent-circuit approximation V_term=V_oc−IR for discharge current I>0. Stipulate V_oc=3.8 V for both fictional batteries at the compared state, with R_A=0.03 Ω and R_B=0.06 Ω. Each still has the separately defined 8 Ah capacity result. The resistor model isolates one mechanism supported by the more detailed voltage/resistance models in the technical sources [1][2][5]. It omits dynamic polarization, changing SOC and temperature, and all other loss paths.
At I=10 A, the voltage drops are 0.30 V and 0.60 V, giving terminal voltages 3.50 V and 3.20 V. P_term=V_term I gives 35 W and 32 W. The modeled resistive dissipation I²R is 3 W and 6 W. In each case V_oc I=P_term+I²R=38 W, so the power accounting closes at this local model boundary. The doubled resistance doubles the loss at fixed current; it does not halve the terminal power at that fixed current. Its effect on a permitted current ceiling is a different calculation, which requires an explicit voltage constraint.
A voltage floor changes the available current headroom
Add one invented rule to the same local model: terminal voltage must stay at or above 3.2 V. With the assumed 3.8 V open-circuit value, there is 0.6 V of available voltage drop. Battery A reaches that floor at 0.6/0.03=20 A. Battery B reaches it at 0.6/0.06=10 A. The allowed-current ceiling from this one condition is therefore different even though both batteries have the same stated capacity retention.
At those separate boundary currents, terminal power is 3.2×20=64 W for A and 3.2×10=32 W for B. These are outputs at the invented voltage-floor boundary, not real safe power ratings. A real system can impose other current, temperature and component constraints, and its voltage response changes with operating state [5][6]. The comparison answers a narrower question: what does this one voltage rule permit in the declared model? It also explains why the earlier equal-current result and this result differ. One held the current fixed; the other found a different boundary current for each resistance.
Impose the illustrative lower terminal-voltage bound V_min=3.2 V while retaining V_oc=3.8 V. For the positive fixed R model, V_oc−IR≥V_min gives I≤(V_oc−V_min)/R. The single-constraint limits are I_A≤20 A and I_B≤10 A. At their respective boundaries, P_A=V_min I_A=64 W and P_B=32 W. These are values at a specified constraint, not a derivation of a production cell's certified or thermally sustainable power.
Within these allowed intervals, P(I)=V_oc I−RI² is still increasing: its derivative is V_oc−2RI, which equals 2.6 V at either stated boundary. Thus the voltage constraint, rather than the unconstrained parabola's peak, determines the maximum output within this restricted toy domain. Other electrical, thermal and dynamic limits are deliberately absent. The sources establish that impedance and operating conditions affect capability, but supply none of the invented values [5][6]. Equal capacity retention leaves this response information unresolved. A report that names only H_Q cannot recover R, V_oc, V_min or a load-dependent power allowance from that percentage alone.

A resistance value needs a time scale and operating state
The resistor in the example has one fixed value because we chose a simple model. A real battery has a richer response. CALCE describes impedance measurements in which the response depends on the frequency of a varying electrical signal, and it distinguishes different resistance-related contributions [2]. Texas Instruments likewise explains why a model suited to slowly changing loads may need more detail when loads change rapidly [5]. A number labelled resistance is therefore more useful when its measurement method is included.
Keep the battery's state with that number. Temperature and state of charge can affect the response, and a value observed under one set of conditions need not represent another [1][2][5]. Two reports might use different pulse durations, different states or a different impedance frequency. An apparent disagreement then needs interpretation before it becomes evidence of a changed battery. This is also why our 0.03 and 0.06 ohm values are stated as model inputs, not inferred from capacity. A useful comparison asks whether the method, timing and operating conditions match. The label 'ohms' supplies a unit; it does not supply all those missing details.
An electrochemical cell is not generally described by a single frequency-independent resistor. CALCE's EIS explanation separates real and imaginary response and discusses ohmic and charge-transfer contributions; it also describes their dependence on state and aging [2]. A pulse-derived voltage/current ratio is an effective response over its defined observation interval, whereas an AC impedance result belongs to a specified frequency and convention. Equating these numbers without their protocols discards information about the dynamics being represented.
Temperature, SOC, prior conditions and the applied load profile are therefore part of a meaningful resistance comparison. TI's dynamic-gauging discussion explicitly motivates a more detailed transient model for changing loads and notes temperature-dependent resistance [5]. This supports the need for conditions, not a universal aging curve or a promise about every EV estimator. The local resistor approximation remains useful for exposing I R voltage drop and I²R dissipation, provided its scope is retained. It cannot determine the whole spectrum, thermal evolution or capacity from one parameter. Reports should identify the method and state before treating an observed resistance change as an irreversible degradation estimate.
A revised estimate is different from a physically renewed battery
Health is often estimated from electrical observations rather than directly read by a sensor that measures a percentage. The system can observe voltage, current and temperature, then combine them with a battery model and earlier information. Analog Devices describes that combination, and TI discusses updating resistance information as operating data become available [1][5]. A displayed result therefore contains both physical evidence and an interpretation of that evidence.
Suppose an estimate changes after the system gains more useful observations. That alone does not prove that the battery has physically gained or lost the same fraction of capacity since the previous display. The estimate may have changed because its information, conditions or model parameters changed. To evaluate a trend, preserve the method and reference as well as the date and value. A higher reading is not automatically rejuvenation; a lower reading is not automatically a newly discovered safety fault. The right follow-up is to understand what was updated and what the reported measure covers. This interpretation does not require inventing a deep-discharge routine or attempting to force a battery-management system to relearn.
Distinguish observed signals from inferred health parameters. A BMS or diagnostic model may use voltage, current and temperature with prior characterization, state estimates and parameter updates. Analog Devices describes model-based estimation and recalibration of releasable-capacity information; TI describes resistance estimation under variable loads [1][5]. The resulting health output is conditional on that model and the information available, not an independently sensed percentage with a universal definition.
A change in an estimate can therefore combine a change in the physical battery with a change in parameter identification, reference or operating conditions. The displayed difference alone does not identify those contributions. A longitudinal record should retain the estimation method or version, relevant conditions, capacity boundary and confidence information where provided. This is especially useful when comparing an onboard estimate with a different diagnostic report. Neither should silently inherit the other's definition. The article does not propose a recalibration protocol; it explains why information updates can alter a reported state without proving an equally sized instantaneous physical change.
Present condition does not uniquely predict remaining life
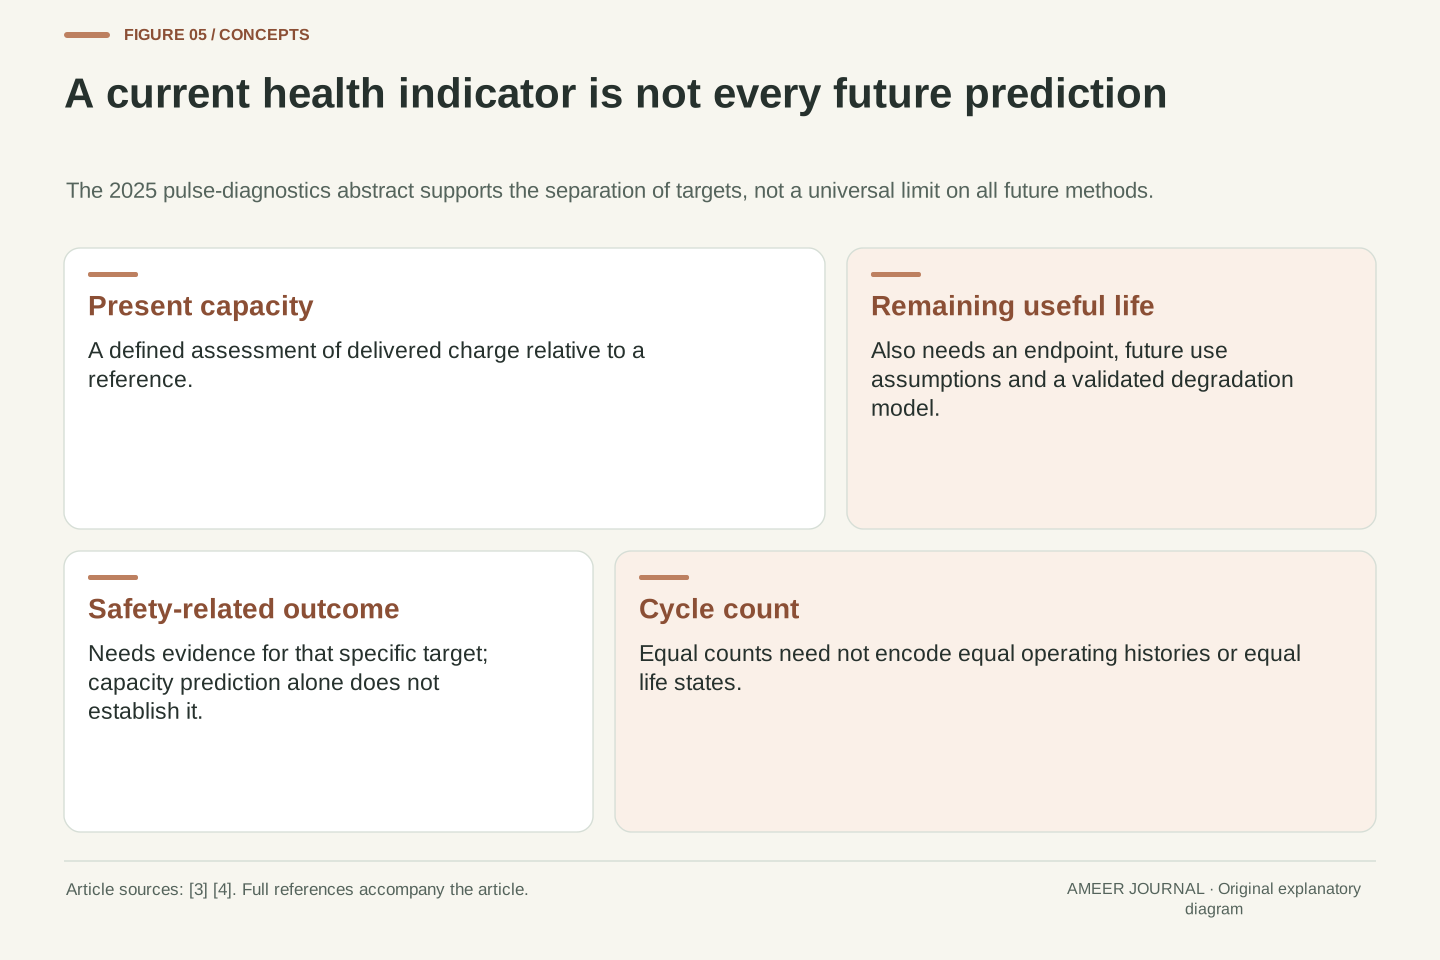
An 80% capacity result does not state how many months or cycles remain. A future-life prediction also needs a definition of its endpoint and assumptions about future use. NASA's battery-aging dataset describes cells with different histories and notes that equal cycle indices need not mean equal states of life [3]. Counting cycles alone therefore loses information about what happened during those cycles and the conditions in which the battery operated.
The limits also apply to short diagnostic measurements. The public abstract of a 2025 study recorded by the national laboratory reports useful capacity prediction from pulse data, while finding that the studied approach did not provide an adequate remaining-life estimate or reliable prediction of its safety-related targets [4]. That is a result for the study, not a claim that every future diagnostic must fail. It shows why capacity, lifetime and safety are separate questions that need their own validation. A reassuring capacity percentage cannot substitute for evidence about another target. Equally, a capacity decline by itself does not identify a particular fault mechanism or establish a complete safety assessment.
State estimation and prognostics have different targets. A current H_Q result compares present charge capacity with its reference. Remaining useful life additionally requires an endpoint criterion, a future operating trajectory and a model relating that trajectory to degradation. NASA's dataset description emphasizes intrinsic variability and differences in discharge history and rest periods, such that equal cycle indices do not uniquely identify equal life states [3]. A present scalar cannot encode all those histories and future conditions.
A 2025 laboratory publication's public abstract provides a bounded empirical example: the studied pulse-based approach predicted capacity usefully but was insufficient for remaining-life estimation, and its investigated safety targets were not accurately predicted [4]. Only that accessible abstract is used here, without claiming a reanalysis or universal method limit. Validation for one target does not transfer automatically to another. For the same reason, no fixed capacity threshold in this article declares a vehicle unusable, safe, repairable or eligible for replacement. Those decisions require their own applicable evidence; our invented 80% score is a capacity definition, not a service rule.
Compare the definitions before comparing the percentages
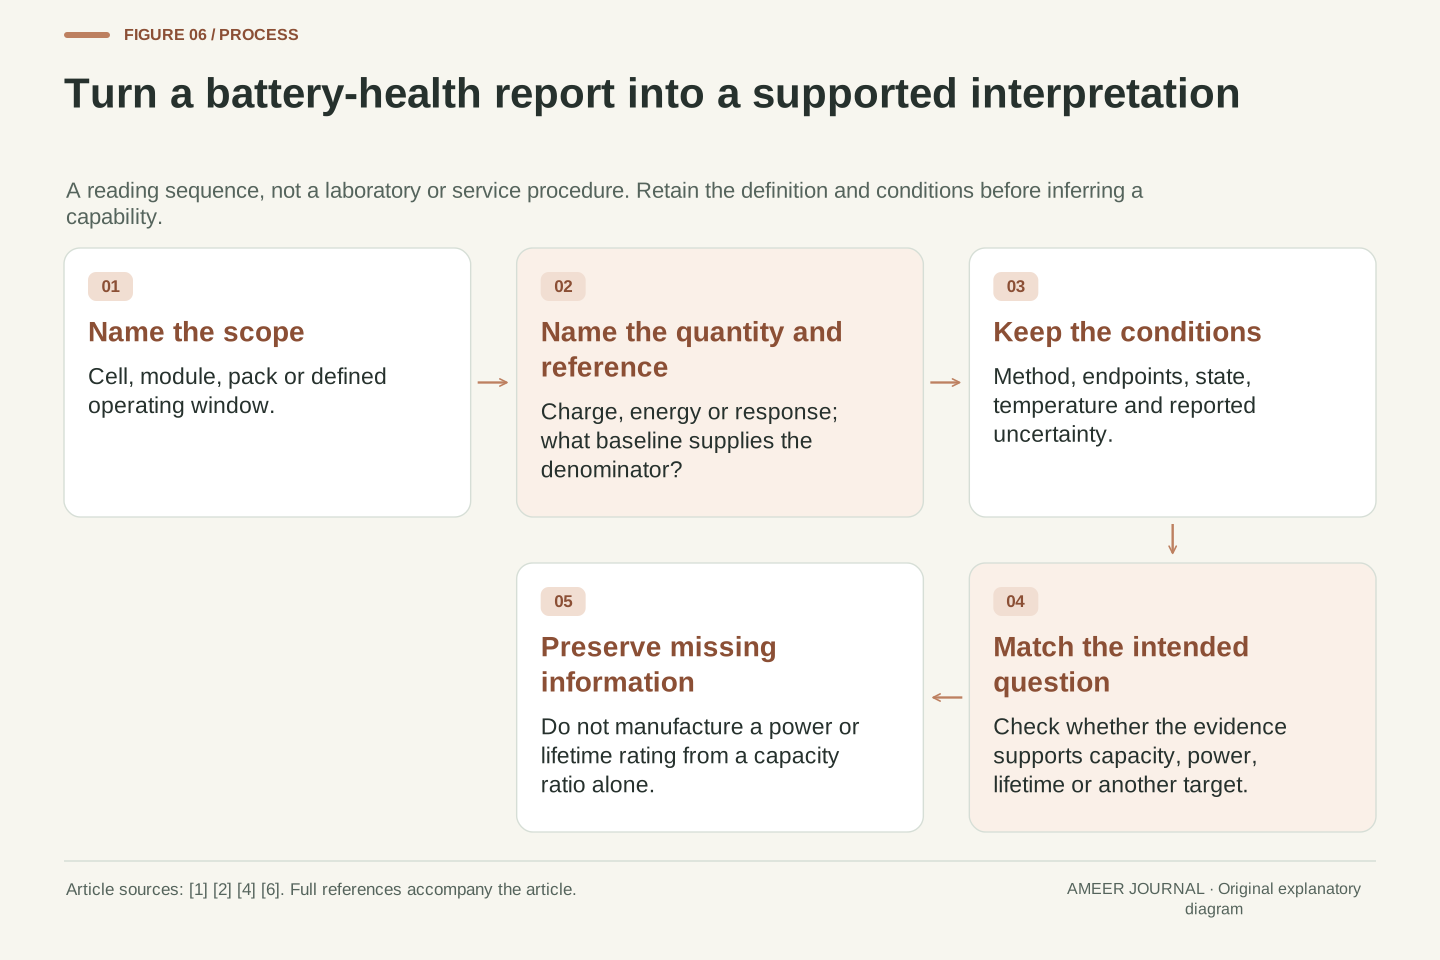
When two reports disagree, first identify the battery or scope they describe. Is the number for one cell, a module, a pack, or an available operating window? Then identify the quantity: charge capacity, terminal energy, resistance or a manufacturer-defined composite. The National Academies notes that cell differences can matter to a series pack [6]. A pack result should not be assumed to equal an unexplained average of isolated cell scores.
Next, compare references and conditions. Keep the original rating or measured baseline, the method, relevant temperature and state, and any stated uncertainty. If the report offers an energy figure, retain its measurement boundary and endpoint instead of replacing it with a charge figure carrying the same percentage. Finally, read what the provider actually says the result supports. Our equal-capacity example needed resistance, voltage and a voltage floor to answer its power question. Without those additional inputs, the honest conclusion is limited information, not a guessed performance rating. This sequence turns a vague disagreement into specific questions that a documented diagnostic method can answer.
A comparison record should name the physical scope, health measurand, reference, observation or estimation method, operating conditions and uncertainty where available. Cell, module and pack boundaries are distinct. The National Academies discusses how cell-to-cell variability and limiting cells affect series-pack behavior [6]; that is a reason to preserve scope rather than to construct a pack score by arbitrary averaging. The article does not infer cell-level defects from an aggregate percentage.
Use those fields to test comparability before computing a difference. Charge capacity under one endpoint is not automatically equivalent to energy under another, and an effective DC response is not interchangeable with an unspecified impedance magnitude. A target-specific validation statement should remain attached to its actual target. In the toy model, H_Q supplies neither the voltage-response parameters nor the operating bound needed for the current calculation. A more detailed report may provide such information, but the capacity percentage itself does not. The practical output of this process is a documented interpretation of what is known and which additional inputs are missing.
Read the score together with the capability it describes
Return to the two fictional batteries. Each has 8 Ah compared with a 10 Ah reference, so each receives the same 80% charge-capacity score. In the separately defined load model, their different resistances produce different terminal voltages and losses at 10 A. Under the invented 3.2 V floor, their allowed-current boundaries also differ. None of those calculations contradicts the equal capacity result. They answer additional questions that the capacity ratio did not settle.
The energy example adds another distinction: 80% of the charge can accompany about 75.6% of the terminal energy when the charge-weighted average voltage changes. A complete reading therefore starts with the measured or estimated quantity and its reference, then examines the conditions and the capability of interest. Technical sources support using capacity, impedance and suitable models to understand battery condition [1][2][5][6]. Their value comes from keeping those meanings clear. A percentage becomes useful when it tells you precisely what was compared; it becomes misleading when it is asked to stand for every aspect of the battery at once.
The worked cases separate three relationships: H_Q=8/10=0.80; H_E=(8×3.4)/(10×3.6)≈0.7556; and the local voltage-limited current I_max=(V_oc−V_min)/R. The first two are normalized measurements under defined boundaries. The third requires a response model and an explicit operating constraint. None can be reconstructed from either of the others without additional assumptions. The same-capacity A/B comparison therefore demonstrates an information limit rather than a contradiction in battery physics.
A useful health interpretation preserves the measurand, reference, test or estimation conditions, and target capability. Capacity and impedance can both inform the assessment, while detailed voltage behavior and operating limits determine how a particular load is supported [1][2][5][6]. Prediction of future life and safety-related outcomes remains separately validated. This framework lets a reader ask a precise question of a report: does it actually measure or estimate the quantity needed for this conclusion? Where it does not, retain that uncertainty instead of converting a familiar percentage into an unsupported power, lifetime or condition claim.
Sources & further reading
Explore the references behind this guide. External pages may change after our review.
- A Closer Look at State of Charge (SOC) and State of Health (SOH) Estimation Techniques for Batteries | Analog DevicesAnalog Devices · Accessed 6 Nov 2026
- CALCE Battery Group - TestingUniversity of Maryland, Center for Advanced Life Cycle Engineering · Accessed 6 Nov 2026
- Li-ion Battery Aging Datasets - Dataset
-
NASA Open Data PortalNASA Ames Prognostics Center of Excellence / NASA Open Data · Accessed 6 Nov 2026
- Searching for a Pulse: Evaluating the Use of Rapid DC Pulses for Diagnosing Battery Health, State-of-Charge, and Safety: Article No. 060503
- National Laboratory of the RockiesNational Laboratory of the Rockies research publication record · Accessed 6 Nov 2026
- SSZTD84 Technical article | TI.comTexas Instruments · Accessed 6 Nov 2026
- Read "Assessment of Technologies for Improving Light-Duty Vehicle Fuel Economy—2025-2035" at NAP.eduNational Academies of Sciences, Engineering, and Medicine · Accessed 6 Nov 2026
Article updated 6 Nov 2026.
Found something we should revisit?
Good explanations get better with thoughtful feedback.