What you’ll take away
- A battery percentage is an estimate under a defined reference, not a direct measurement of future driving distance.
- Current counting needs a starting state and capacity reference; persistent measurement bias accumulates with time.
- Capacity retention and present charge level are different ratios, even when both are displayed as percentages.
- A range forecast also needs an energy-consumption assumption; cold conditions and aging require separate interpretation.
- Use the correct vehicle guidance and support process; the examples do not prescribe deep-discharge calibration or battery maintenance.
Three readings, three questions
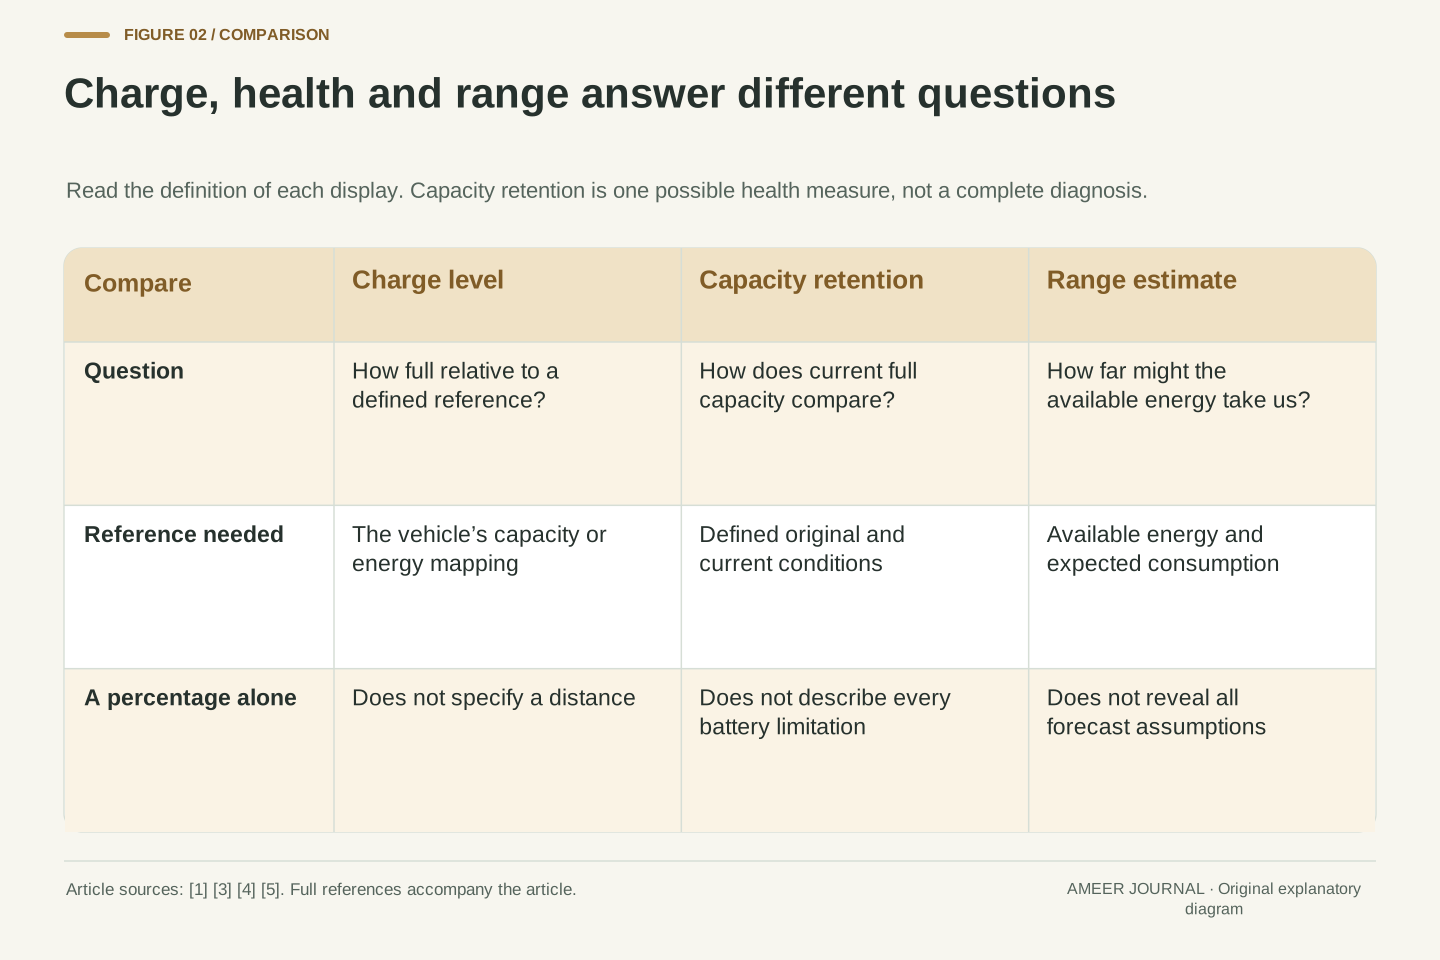
An EV can show a battery percentage, a predicted driving distance and a battery-health result. Those numbers answer different questions. State of charge, usually shortened to SOC, describes how full a battery is relative to a stated capacity reference. A health measure describes its condition compared with a reference such as its earlier capacity. Range estimates how far the available energy might take the vehicle. The first is a proportion, the second needs a definition of health, and the third also depends on how the car will be used. Confusing them can make an ordinary change look like a fault. [1][3][4]
Start by reading the label attached to the number. A dashboard may describe its percentage in terms of remaining battery energy, while an engineering explanation may define SOC using electrical charge. Tesla, for example, describes its percentage display as battery energy remaining and distinguishes its displayed distance from a consumption-based estimate in the Energy app. Those are documented Tesla display choices, not a rule for every EV. [4] The useful habit is to ask what is being estimated, what it is being compared with, and what assumptions turn it into a number you can use. A percentage alone does not answer all three questions.
State of charge is a normalized battery-state estimate, but its reference must be specified. A charge-based definition uses remaining releasable charge divided by a defined charge capacity. State of health is a separate characterization of condition; capacity retention is one possible metric rather than a complete description of every limitation. Remaining driving range adds a demand model to an estimate of available energy. The resulting outputs therefore differ in both units and interpretation: a dimensionless fraction, a defined condition metric, and a distance. MathWorks documents an SOC estimator with a nominal capacity denominator, while Analog Devices describes residual charge relative to battery capacity. [1][3]
Do not silently equate those engineering definitions with every user-interface implementation. Tesla's support documentation describes a percentage of battery energy remaining and an EPA-based distance display, with consumption-based projections available separately. [4] This article uses a charge-normalized teaching model where stated and a separately specified energy budget for its range calculation. It does not infer a vehicle manufacturer's internal estimator from the appearance of the display. Identifying the measured signals, reference capacity, usable operating limits and downstream forecast is more informative than treating every percentage as a directly measured physical quantity with an identical definition across vehicles.
Measure signals, then estimate the state
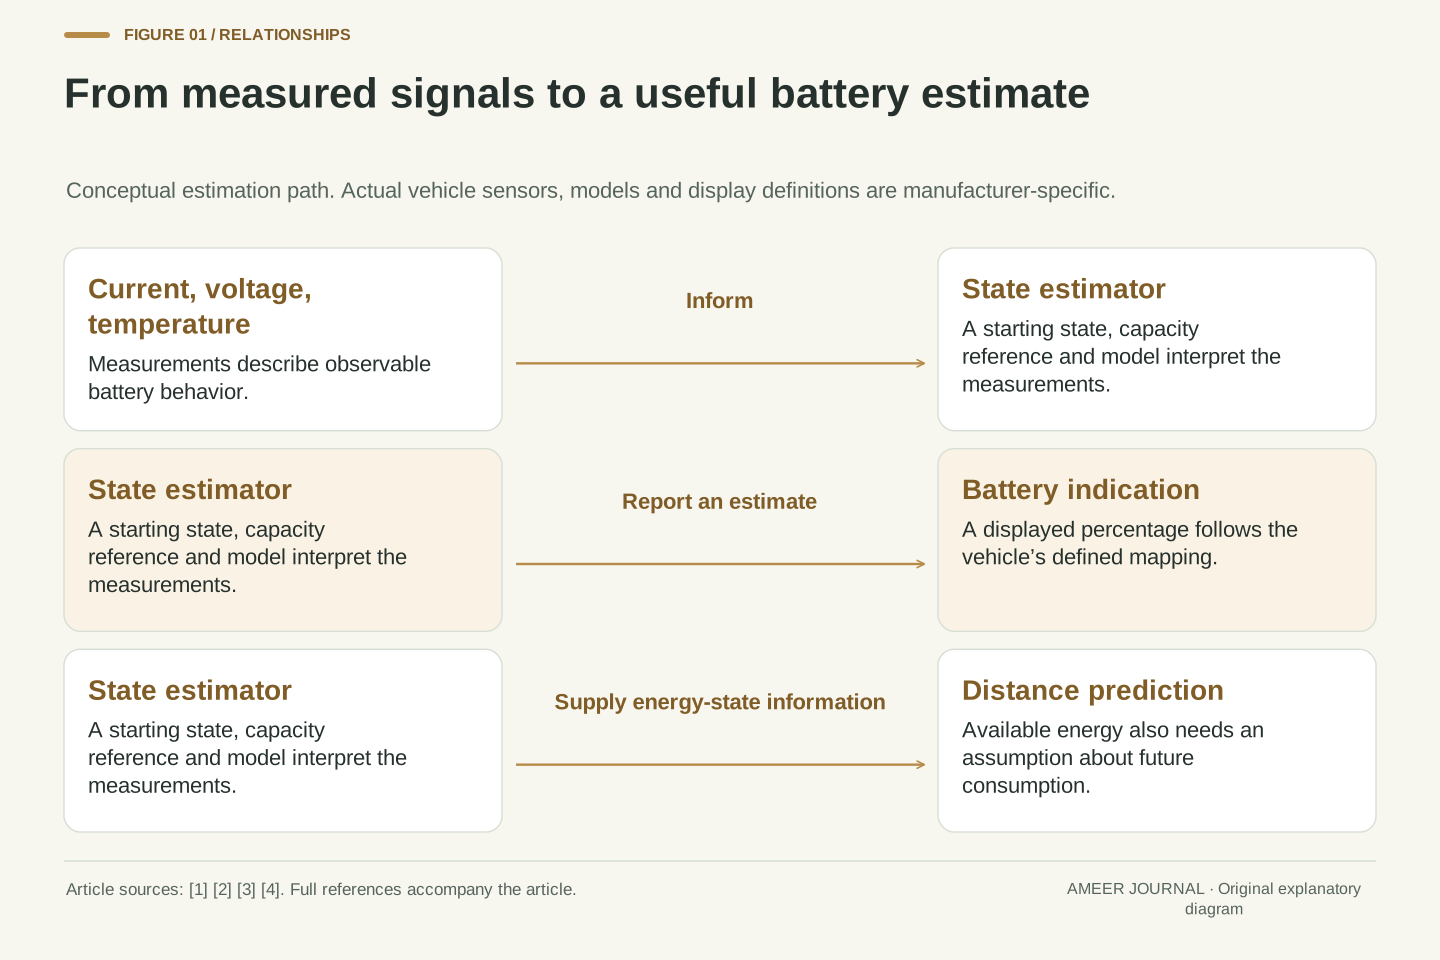
There is no simple window into the battery showing a liquid level. A battery gauge works with electrical measurements and a model of how the battery behaves. Useful inputs include current, voltage, temperature and time. Current tells the system about charge moving into or out of the battery. Voltage gives another clue, but its meaning changes with conditions. The model connects those clues with the quantity the gauge is trying to report. Component manufacturers distinguish the measurement circuitry from the algorithm that turns measurements into an estimate. [2][3] Understanding that division explains why a precise-looking number can still involve uncertainty.
Voltage is especially easy to misread. Drawing current changes a battery's terminal voltage, and temperature and the battery's recent history also matter. After the load falls, the voltage can gradually recover without a charger adding energy. A flat part of the voltage curve can also make a small measurement error important when someone tries to infer charge from voltage alone. [2][3] These facts do not make voltage useless; they make context essential. A battery-management system needs an appropriate interpretation of its signals. The component references explain that principle, while the particular sensors and algorithms in an individual car remain manufacturer-specific.
A battery-management system estimates an internal state from accessible electrical and thermal signals. Current integration constrains charge transfer; terminal voltage contains information about electrochemical state together with load-dependent and time-dependent effects; temperature changes the interpretation of those observations. TI explicitly separates measurement hardware from the battery model and gauging algorithm, and Analog Devices describes monitors that expose measurements to a host as well as gauges that perform estimation internally. [2][3] These are complementary implementation examples. They do not establish that a named gauge IC or a particular algorithm is installed in the EV a reader owns.
The distinction between terminal voltage under load and an appropriate open-circuit-voltage relationship matters. Load current, temperature, relaxation and battery condition affect a voltage reading, while a comparatively flat voltage-versus-charge region weakens the information available from one voltage observation. [2][3] A highly repeatable voltmeter can therefore provide an accurate measurement that remains insufficient for an accurate state estimate. Measurement precision and state observability are different properties. A practical estimator may combine the recent charge-transfer history with a model-informed voltage interpretation; evaluating that design requires its assumptions and operating conditions, rather than a single voltage threshold borrowed from another chemistry or application.
Build a charge ledger you can check
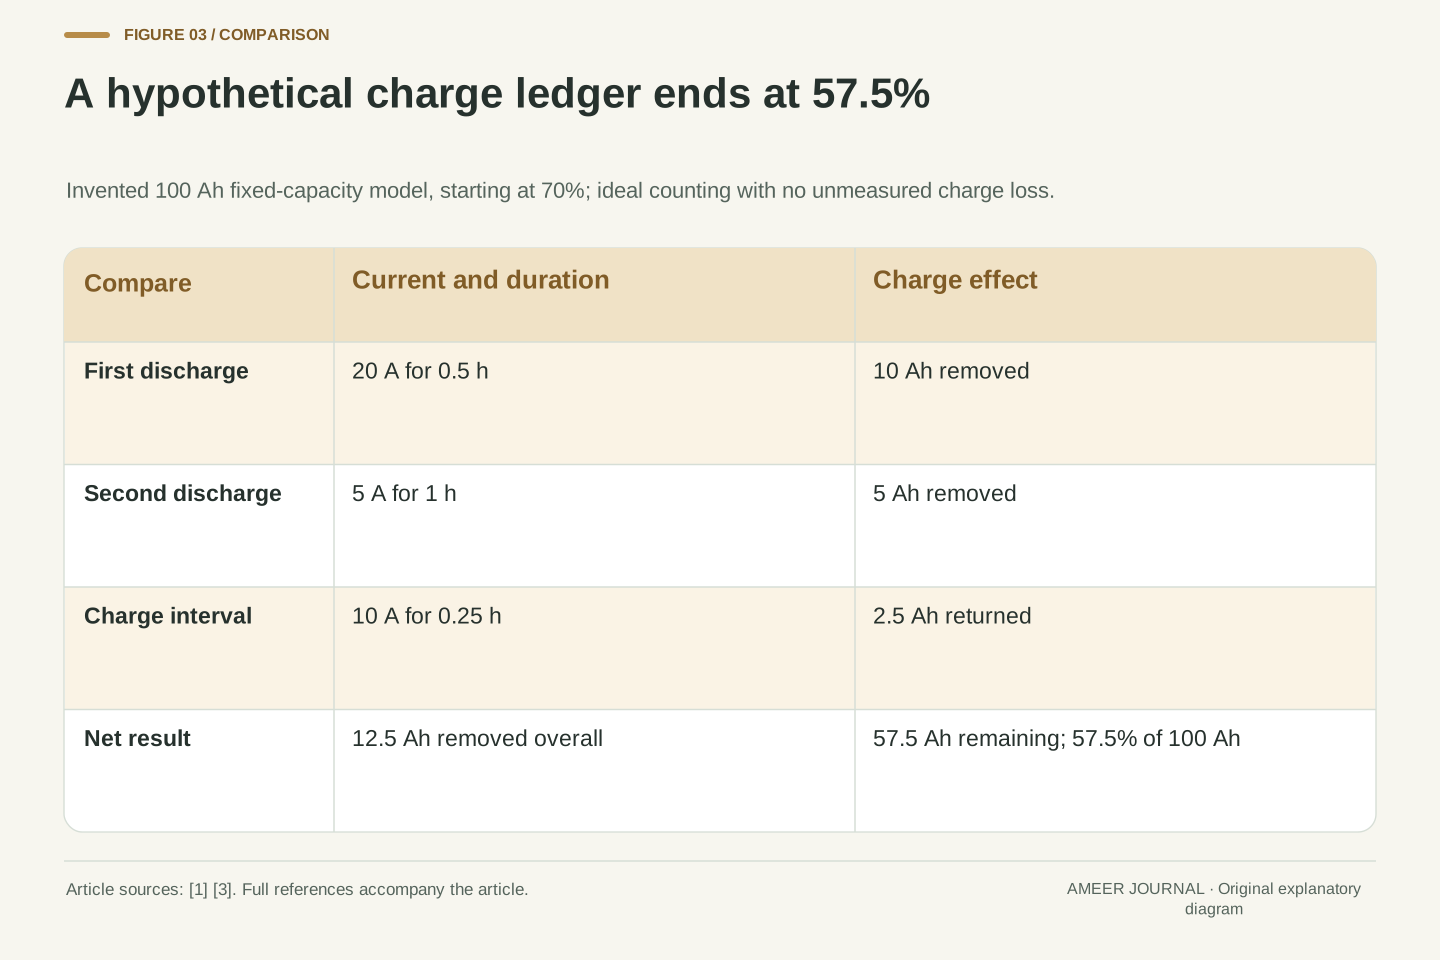
Consider a completely hypothetical battery with a fixed reference capacity of 100 ampere-hours, or Ah, starting at 70% charge. An ampere-hour describes charge transfer: a steady current of one ampere for one hour transfers one Ah. Our teaching example assumes perfect counting, no unmeasured loss and no change in the capacity reference. First, a 20-ampere discharge lasts half an hour, removing 10 Ah. Next, a five-ampere discharge lasts one hour, removing another 5 Ah. Finally, a ten-ampere charge lasts a quarter of an hour and returns 2.5 Ah. These are invented intervals, not measurements from a car. [1]
The net removal is therefore 10 + 5 − 2.5 = 12.5 Ah. Starting with 70 Ah leaves 57.5 Ah, which is 57.5% of our 100 Ah reference. This is the basic idea of coulomb counting: keep a running account of charge entering and leaving. [1][3] Notice what the calculation needs beyond a current sensor. We had to supply a starting charge, a capacity reference, a clock and a rule for which direction counts as charging. We also made simplifying assumptions about losses. The neat answer is useful because those assumptions are visible, not because a real display necessarily knows its state to the nearest tenth of a percentage point.
Use an original hypothetical charge ledger with Qref = 100 Ah and initial state z0 = 0.70. Define outward current as positive, express duration in hours, and assume unity charge-accounting efficiency, a fixed capacity reference and no unmeasured charge loss. Then z = z0 − Σ(Iout × Δt)/Qref. The chosen sign convention makes charge inflow negative. MathWorks' documented estimator illustrates the same integration principle with its own current convention and explicitly supplied initial SOC and capacity. [1] These assumptions define an educational state variable, rather than a calibrated model of a particular traction battery or its dashboard mapping.
The three intervals are +20 A for 0.5 h, +5 A for 1 h, and −10 A for 0.25 h. Their contributions are +10 Ah, +5 Ah and −2.5 Ah, giving a net discharge of 12.5 Ah over 1.75 hours. Thus z = 0.70 − 12.5/100 = 0.575. If time were expressed in seconds, the Ah denominator would require the corresponding factor of 3,600. That unit conversion is part of the estimator, not a numerical detail that can be ignored. Integrating current gives charge transfer; it does not by itself establish the initial state, update an aging capacity reference, or convert charge into available driving energy. [1][3]
Why the starting point and sensor offset matter
Keeping a perfect running total does not fix a wrong opening balance. Suppose the same hypothetical ledger starts from an assumed 65% when the defined starting value is actually 70%. Subtracting the same 12.5 Ah gives 52.5% instead of 57.5%. The five-percentage-point error remains. A current counter can accurately describe what changed while still being wrong about what is left. That follows directly from the starting-state term in the counting method. [1] It explains why a gauge benefits from information that can check its estimate, rather than only adding more digits to its current reading.
Now keep the correct starting balance but invent a constant sensor offset: every current reading is 0.2 ampere too high in the outward direction. Across the 1.75-hour example, the counter records an extra 0.35 Ah leaving the battery. It reports 57.15% instead of 57.5%, an error of 0.35 percentage point. This is arithmetic for the stated teaching model, not a claim about typical EV sensor accuracy. The lesson is that a small persistent bias accumulates with time. It is different from readings that happen to vary around the correct value. Neither the percentage displayed nor its number of decimal places tells an owner the size or cause of any actual error.
The initial-condition error is preserved by ideal open-loop integration when the same current and capacity are used. In the hypothetical ledger, replacing the correct z0 = 0.70 with 0.65 shifts the final estimate from 0.575 to 0.525. No subsequent exact current sample supplies the missing five percentage points by itself. This limitation follows from the estimator equation and is consistent with MathWorks' separate examples of correcting a state estimate using model-based information. [1] It should not be translated into a claim that every vehicle requires an owner-performed reset or that a particular vehicle's gauge has accumulated such an error.
A constant current offset produces another identifiable error term. With outward-positive measured current Im = I + b, the SOC error caused by that bias is −bT/Qref under the same ideal assumptions. Set the invented bias b = 0.2 A and total duration T = 1.75 h: the excess counted discharge is 0.35 Ah, and the state error is −0.0035, or −0.35 percentage point. The final estimate is 0.5715. A percentage-point error should not be confused with a relative percentage error. This example isolates bias; clock error, sampling behavior, reference-capacity error and model mismatch are different contributors and cannot be assigned numerical values from this toy calculation.
Ask what counts as full
A percentage needs a denominator. Imagine a different hypothetical battery that originally had a 100 Ah reference capacity but can now provide 90 Ah under the same defined test conditions. If 45 Ah remain, that amount is 50% of the current 90 Ah full capacity, but 45% of the original 100 Ah reference. Those two calculations describe the same remaining charge with different denominators. For this example, capacity retention is 90/100, or 90%. It is a deliberately defined health measure, not a complete diagnosis. Battery capacity depends on conditions and can change with aging; the reference needs to be stated. [1][3][5]
This also explains why charging to a displayed 100% does not necessarily restore the energy the vehicle could hold when new. Filling the currently available operating range and reversing aging are different ideas. Tesla's Model 3 manual, for example, describes a gradual reduction in maximum range as its battery ages. [5] Owners should use their vehicle's documented display and health information rather than trying to replace the manufacturer's calculation with an improvised denominator. The simple comparison above helps interpret a report. It does not reveal hidden battery reserves, define the usable limits of a particular pack or establish whether a service or warranty condition has been met.
Capacity normalization must be explicit. In a separate hypothetical comparison, let original reference capacity Qoriginal = 100 Ah, current full capacity Qcurrent = 90 Ah, and remaining charge Qremaining = 45 Ah, all defined for the same relevant conditions. Qremaining/Qcurrent = 0.50, whereas Qremaining/Qoriginal = 0.45. Capacity retention, as defined for this example, is Qcurrent/Qoriginal = 0.90. These are different ratios with different purposes. MathWorks specifically notes that its nominal-capacity coulomb-counting block does not account for aging; a model using that denominator is not automatically an estimator of current full capacity. [1] Physical capacity also depends on its measurement conditions. [3]
The comparison does not prescribe the normalization used by an individual EV or reduce battery health to one universal number. A reported full state refers to the relevant operating reference; it does not imply restoration of initial capacity. Tesla documents natural degradation and the associated potential reduction of fully charged driving range for Model 3. [5] An owner-facing interpretation should therefore keep present fill level, capacity retention and the manufacturer's health assessment separate. Inferring a hidden buffer, a failing cell, or a warranty entitlement from a single percentage would require evidence absent from the display. Consistent conditions and documented definitions are prerequisites for a meaningful comparison over time.
Turn an energy estimate into a range estimate
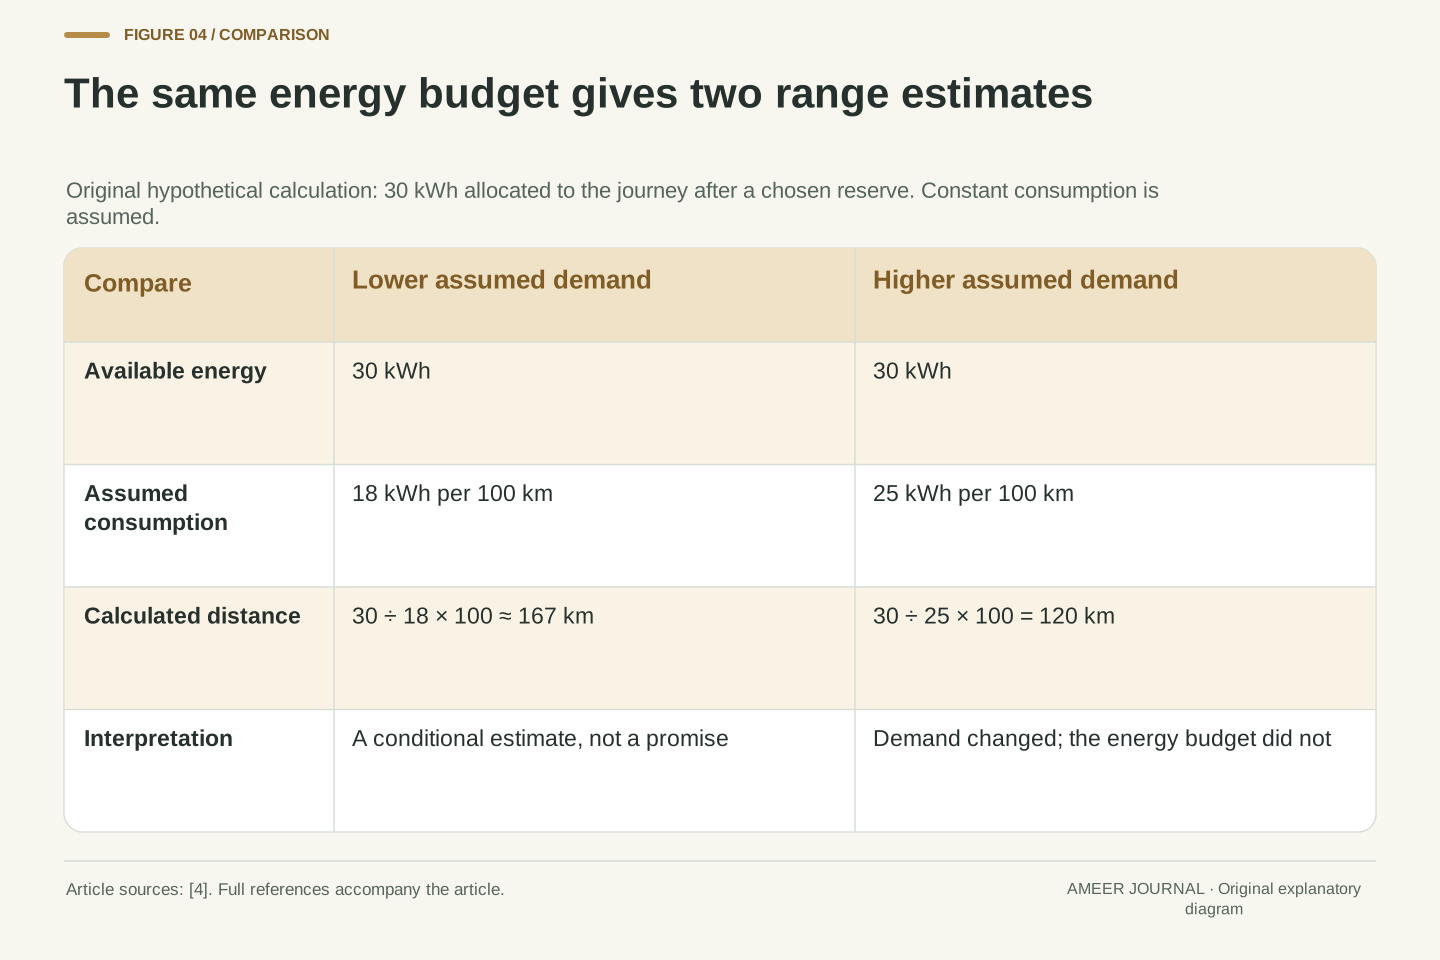
Driving distance needs an energy budget as well as a battery reading. In another clearly hypothetical example, assume a separate estimate says 30 kWh can be used for the journey after whatever reserve the planner has chosen. If expected consumption is 18 kWh per 100 km, dividing 30 by 18 and multiplying by 100 gives about 167 km. At 25 kWh per 100 km, the same available energy supports 120 km in the model. The battery energy did not change between these calculations; the assumed demand did. Neither result is a promise of actual driving distance, and the 30 kWh figure was not inferred directly from a percentage.
A vehicle display may use a different consumption assumption from a route prediction or a recent-driving graph. Tesla's support page explains that its distance display uses EPA certification data, while its Energy app provides projections based on selected consumption history. [4] A change in one estimate does not automatically mean the battery's capacity changed. Ask whether you are comparing the same type of prediction, over the same conditions and with the same reserve. For an actual journey, use the manufacturer's planning tools and a suitable charging plan. Treat the example as a way to understand the inputs, not as a replacement for the vehicle's warnings or route information.
A simple range calculation is R = Eavailable/e, where Eavailable is usable energy allocated to the trip and e is energy consumption per unit distance. For an original hypothetical case, set Eavailable = 30 kWh after a separately chosen planning reserve. At e = 0.18 kWh/km, R = 166.7 km; at e = 0.25 kWh/km, R = 120 km. The latter scenario changes the assumed demand, not the energy allocation. No SOC-to-energy conversion is implied: the 30 kWh input is stipulated independently. Actual route models can account for changing demand along a journey rather than using one constant average for the entire trip.
The interpretation of a displayed distance therefore depends on its forecast model. Tesla distinguishes the EPA-based distance display from Energy-app projections informed by consumption history. [4] Those estimates need not agree because their assumptions differ. A comparison of two displayed mileages is not a controlled capacity measurement unless the energy reference and consumption model are known and comparable. Even a correctly estimated state of charge cannot guarantee range when future demand is uncertain. Conversely, a shorter range prediction may reflect a revised demand assumption without establishing a loss of stored charge. Keep the range calculation downstream of the battery-state estimate when evaluating what a change actually demonstrates.
Separate a cold battery from an aged battery
Cold conditions can affect how much stored energy is currently available for use, as well as how much energy the car needs. These effects should not all be called permanent battery damage. In the U.S. Model 3 manual, a blue snowflake indicates that some stored energy is unavailable because the battery is cold; the indication disappears when the battery is sufficiently warm. The same passage explains that charging, acceleration and regenerative braking may be limited. [6] This is a documented example of a temporary operating restriction. Other vehicles may communicate their limits differently, so the symbol and its meaning should come from the correct manual.
Aging is a different question: how the battery's longer-term condition has changed. A cold morning and a warm afternoon are poor conditions for comparing capacity unless the vehicle's diagnostic method accounts for temperature. The example of 90 Ah remaining full capacity in the earlier section assumed comparable conditions; without that assumption, the ratio would be harder to interpret. [3][5] Warming a battery also does not create electricity. The car may use energy while heating itself or its cabin. A change in access to stored energy and energy spent on warming can happen together. Reading both the operating conditions and the vehicle's indications is more useful than judging health from one changed number.
Temperature-dependent deliverability and irreversible capacity change should be analyzed separately. Terminal-voltage behavior and the charge deliverable before an operating cutoff depend on temperature and load; an SOC or available-energy interpretation needs an appropriate model of those conditions. [2][3] Tesla provides a concrete user-interface example: its U.S. Model 3 manual associates the blue snowflake with stored energy temporarily unavailable because the battery is cold, and states that the icon disappears once the battery is sufficiently warm. It also documents possible limits on regenerative braking, acceleration and charging. [6] These observations do not quantify another vehicle's temperature sensitivity or identify its internal control thresholds.
An assessment of long-term capacity retention requires a comparable reference, rather than comparing an arbitrary cold observation with an arbitrary warm one. The hypothetical 90/100 Ah retention ratio assumes matched relevant test conditions. Tesla separately documents natural aging that can reduce the maximum range available when fully charged. [5] There is no contradiction between an improvement in short-term energy availability as temperature changes and simultaneous energy consumption by thermal management. They affect different terms of the operating budget. Consequently, a dashboard change after warming is insufficient evidence to calculate either degradation or recovered energy without further information about loads, definitions and the estimator's behavior.
Why an estimate can change after the drive
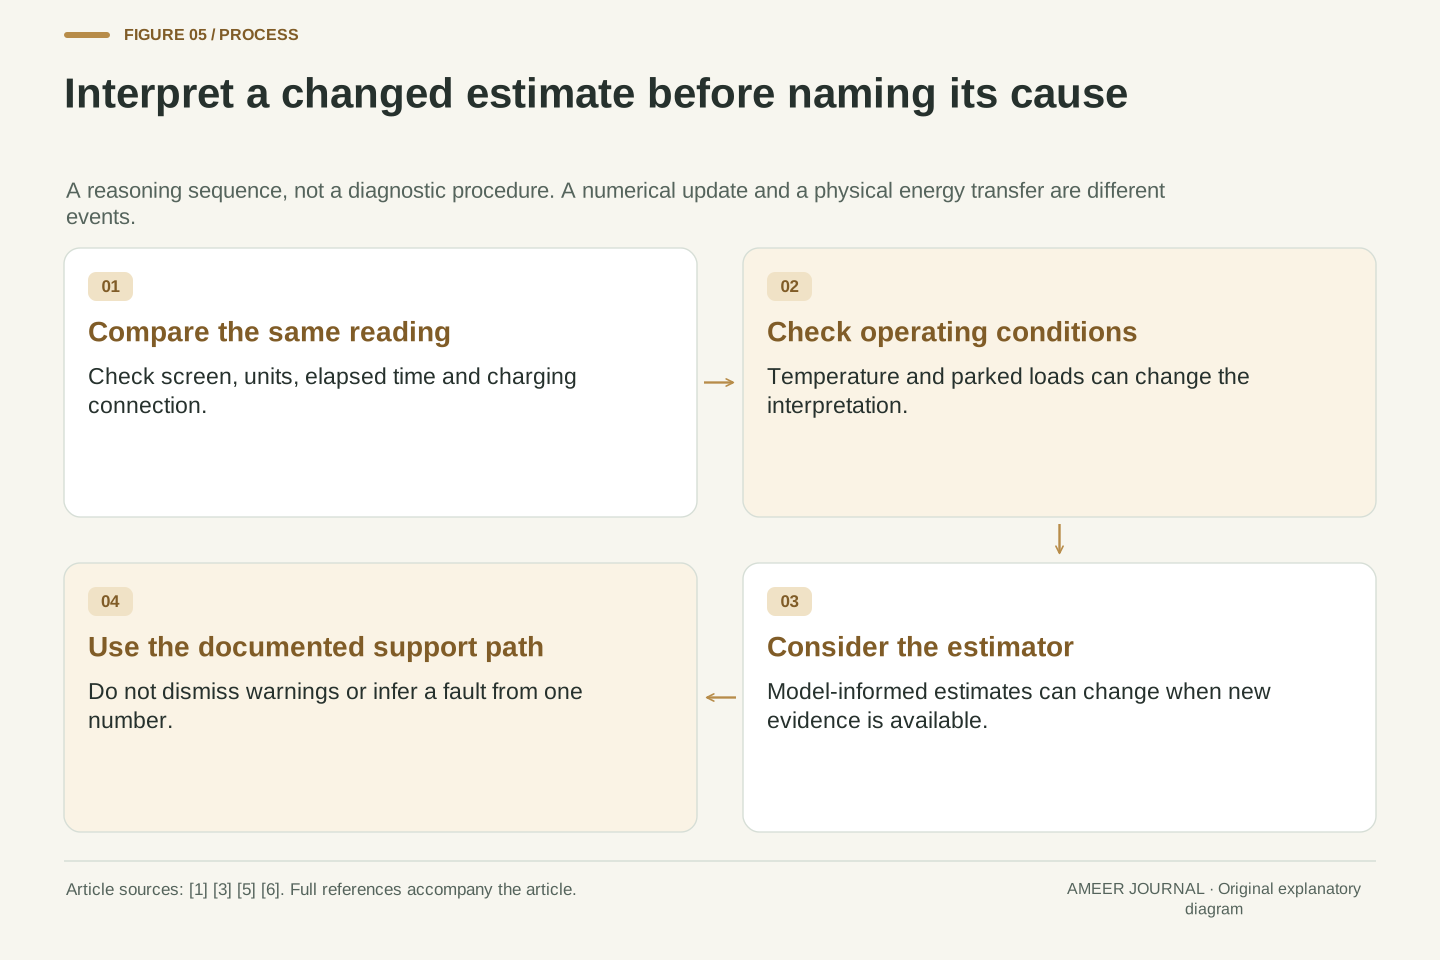
A battery gauge may have more information after conditions settle than it had during a changing load. The voltage can relax after current falls, and an estimator may use an appropriate battery model to check its running charge count. The underlying references describe both current-based estimation and model-informed correction. [1][2][3] A revised estimate does not mean new charge appeared from nowhere. It means the reported understanding of the battery's state may have changed. That is the same distinction as correcting an account balance after finding a bookkeeping error, rather than receiving a new payment.
There is also a less abstract possibility: the car used energy while parked. Tesla documents periodic system activity and support for the low-voltage battery while Model 3 is idle and unplugged. [5] An overnight change can therefore involve real energy use, altered conditions or an estimate revision. The display alone does not separate those causes. A useful observation records the time, whether the car was plugged in, broad temperature conditions, active parked features and the exact screen being compared. That information can make the manufacturer's explanation or a service discussion more specific. It cannot establish that an unexplained large change is harmless, and it should not be used to dismiss a warning.
An estimator that combines charge integration with voltage or parameter information can revise its state when the observations and model support a correction. Analog Devices discusses relaxation and fuel-gauge learning, while MathWorks documents examples of model-based state estimation that correct an initially inaccurate estimate. [1][3] The correction mechanism and any smoothing or display mapping are implementation-dependent. The existence of such methods is not evidence that a particular observed jump came from that mechanism. A state-estimate update changes a numerical representation; a physical energy balance still requires an actual source or sink for any energy transferred.
Parked energy consumption is another possible contributor. Tesla's Model 3 battery documentation identifies periodic system checks and replenishment of the low-voltage battery when the vehicle is idle and unplugged. [5] Distinguishing consumption from an estimation revision requires more than two dashboard screenshots: comparable display definitions, elapsed time, charging connection, operating conditions and relevant background loads are needed. An owner can preserve those ordinary observations without accessing high-voltage hardware or engineering diagnostic buses. The appropriate conclusion from incomplete data is often a set of possible explanations rather than a diagnosis. Persistent unexpected behavior or vehicle alerts should be handled through the documented support process, not explained away by a generic claim about calibration.
Keep charge, power and energy in their own units
The charge ledger used Ah because it counted current over time. Your electricity bill and many driving-efficiency screens use kWh because they describe energy. Voltage links the two, but the voltage can change during use. That is why an ampere-hour count is not automatically an energy reading, and why a percentage of charge cannot always be multiplied by an advertised kWh figure to produce an exact remaining-energy answer. Battery-gauge references discuss charge capacity, voltage and operating conditions as distinct inputs. [1][3] A calculation should say which quantity it uses before presenting a result with apparently precise units.
Power is different again: kW describes an energy-transfer rate at a moment. A high charging-power number does not tell you the battery's present charge percentage or how much energy an entire session will add. Likewise, electricity supplied at a charger is not automatically the change in stored battery energy; a practical comparison needs a stated boundary and treatment of the vehicle's other energy uses. For the examples in this article, the boundaries are deliberately separate: Ah for the charge ledger, a defined capacity ratio for the health illustration, and an assumed battery-energy budget for range. Keeping those columns separate prevents a neat-looking calculation from answering the wrong question.
The electrical quantities have different dimensions. Charge transfer is the time integral of current, ΔQ = ∫I dt. Electrical energy transfer is the time integral of terminal power, ΔE = ∫VI dt, with signs and the measurement boundary defined consistently. If voltage changes, multiplying an Ah total by an arbitrary nominal voltage is an approximation rather than an exact energy integral. The charge-based estimator documentation explicitly integrates current and normalizes by Ah capacity; the fuel-gauge references also identify voltage and operating conditions as relevant to interpretation. [1][3] A displayed energy-based percentage may involve additional modeling beyond that simple charge-normalized state.
Power in kW, energy in kWh and charge in Ah should therefore remain separate in a log or worked example. Battery-terminal electrical energy, usable stored energy and electricity measured outside the vehicle also represent different boundaries; conversion losses and operating loads cannot be assigned to the same quantity without explanation. This article's ledger assumes ideal charge accounting, its capacity-retention ratio assumes matched conditions, and its range calculation begins with a separately stipulated usable-energy allocation. None is a charger-energy audit. Matching dimensions is necessary, but the reference state and boundary are equally important when deciding whether two readings can legitimately be compared.
Use the display without inventing a calibration ritual
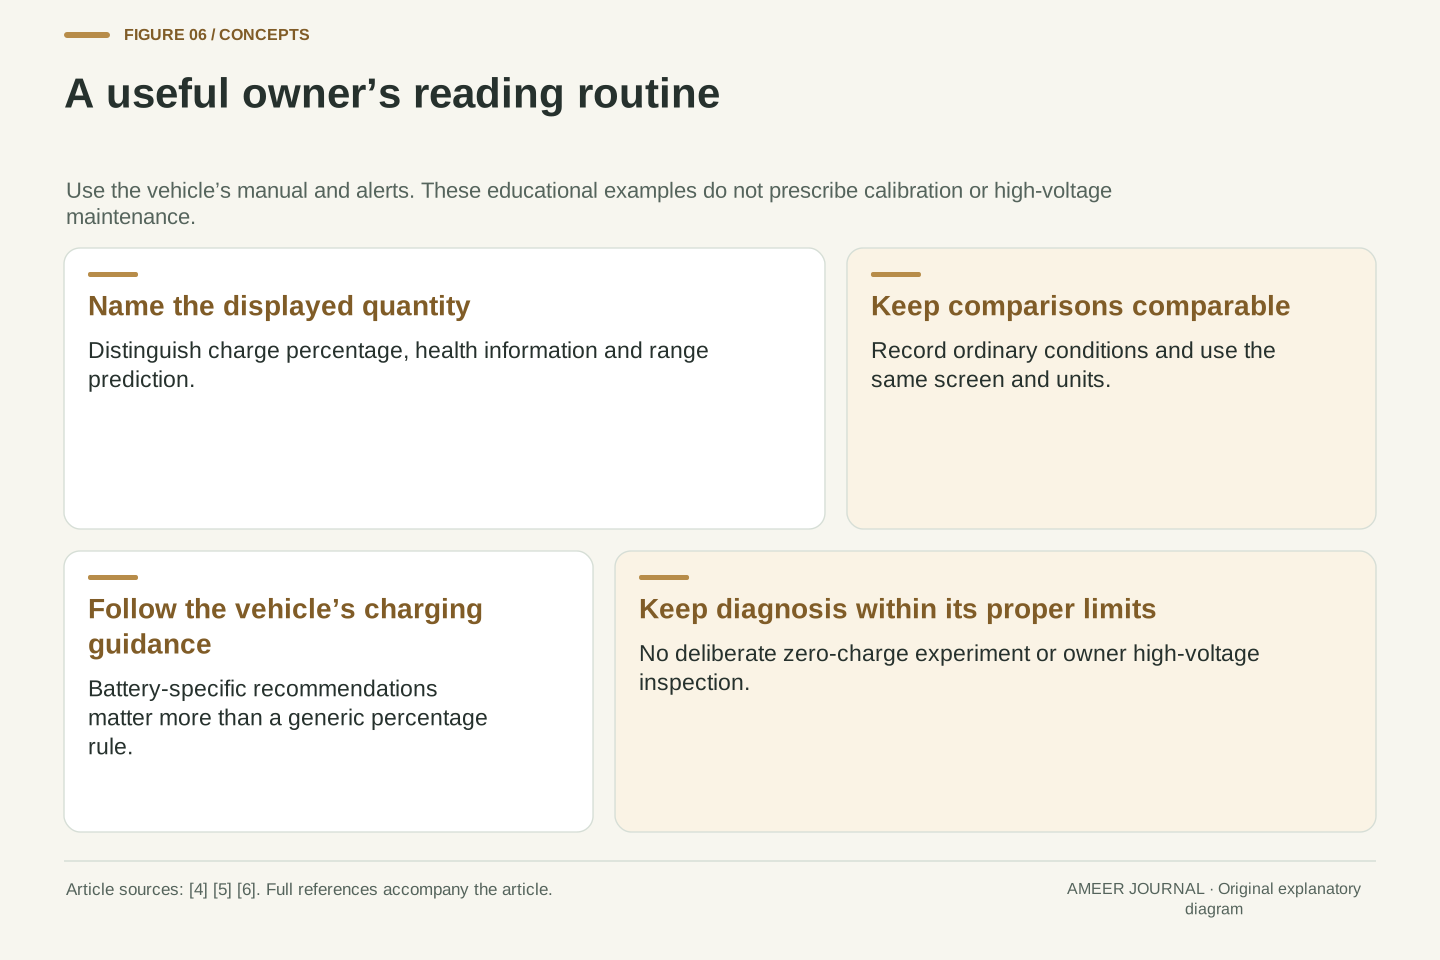
For everyday use, begin with the vehicle's own meaning of percentage and range, its recommended charge settings and its alerts. Tesla's support guidance explicitly says that different batteries require different charging routines, with the recommended limit shown by the vehicle. [4] When a number changes unexpectedly, compare the same screen and note whether temperature, parked features, charging or recent consumption also changed. A short record of those ordinary conditions can support a useful question: did the energy use change, did the forecast assumption change, or is a documented battery check needed? You do not need to turn every normal fluctuation into a new battery-health calculation.
Do not deliberately drain an EV to zero simply because an online explanation mentions correcting a counter. Manufacturer instructions govern actual charging and diagnostics. Tesla's Model 3 manual warns against full discharge and says the high-voltage system is for trained service personnel, with no owner battery maintenance procedure. [5] The worked examples here explain estimation; they do not prescribe a reset, deep-discharge test or pack inspection. Read the percentage as a useful operational estimate with a defined purpose. Use health information to assess condition through the proper process, and use route and consumption information to plan distance. Keeping those roles clear makes all three numbers more useful.
An owner-facing interpretation can follow a bounded sequence: identify the display definition, compare like-for-like readings, record relevant operating conditions, and consult the documented diagnostic or service path when the behavior remains unexplained. Tesla notes that charging routines differ by battery and directs owners to the recommended charge limit displayed by their vehicle. [4] That is a more appropriate operational reference than applying the assumptions of a generic integrator to an unknown production BMS. No percentage, range prediction or standalone hypothetical retention calculation establishes a fault code, health certification or manufacturer-specific operating limit.
The estimation discussion supplies no basis for an improvised deep-discharge calibration. Model 3's documented precautions warn against fully discharging the battery and restrict high-voltage servicing to trained technicians. [5] Those boundaries also distinguish a conceptual explanation from a repair procedure. A useful interpretation preserves uncertainty without discarding the display: SOC describes the estimated present state under its reference, a health metric describes a defined aspect of condition, and range combines an energy estimate with assumptions about demand. Evaluate each against the evidence appropriate to its purpose. When those questions are separated, a changed dashboard number becomes something that can be investigated coherently rather than a reason to infer a physical failure from incomplete data.
Sources & further reading
Explore the references behind this guide. External pages may change after our review.
- SOC Estimator (Coulomb Counting) - State of charge estimator with Coulomb counting - SimulinkMathWorks · Accessed 6 Nov 2026
- SSZT786 Technical article | TI.comTexas Instruments · Accessed 6 Nov 2026
- Battery Fuel Gauges: Accurately Measuring Charge Level | Analog DevicesAnalog Devices · Accessed 6 Nov 2026
- Range Tips | Tesla SupportTesla · Accessed 6 Nov 2026
- High Voltage Battery InformationTesla · Accessed 6 Nov 2026
- Cold Weather Best PracticesTesla · Accessed 6 Nov 2026
Article updated 6 Nov 2026.
Found something we should revisit?
Good explanations get better with thoughtful feedback.