What you’ll take away
- Match the workload counter and endurance rating to the same host-write boundary.
- DWPD depends on both drive capacity and the stated time period; compare absolute quantities when needed.
- Account for prior writes and future workload changes with explicit units and assumptions.
- Percentage Used is a vendor estimate, not an exact failure date or a warranty decision.
- A write budget, health monitoring and recoverable backups solve different parts of the problem.
Treat endurance as a workload question
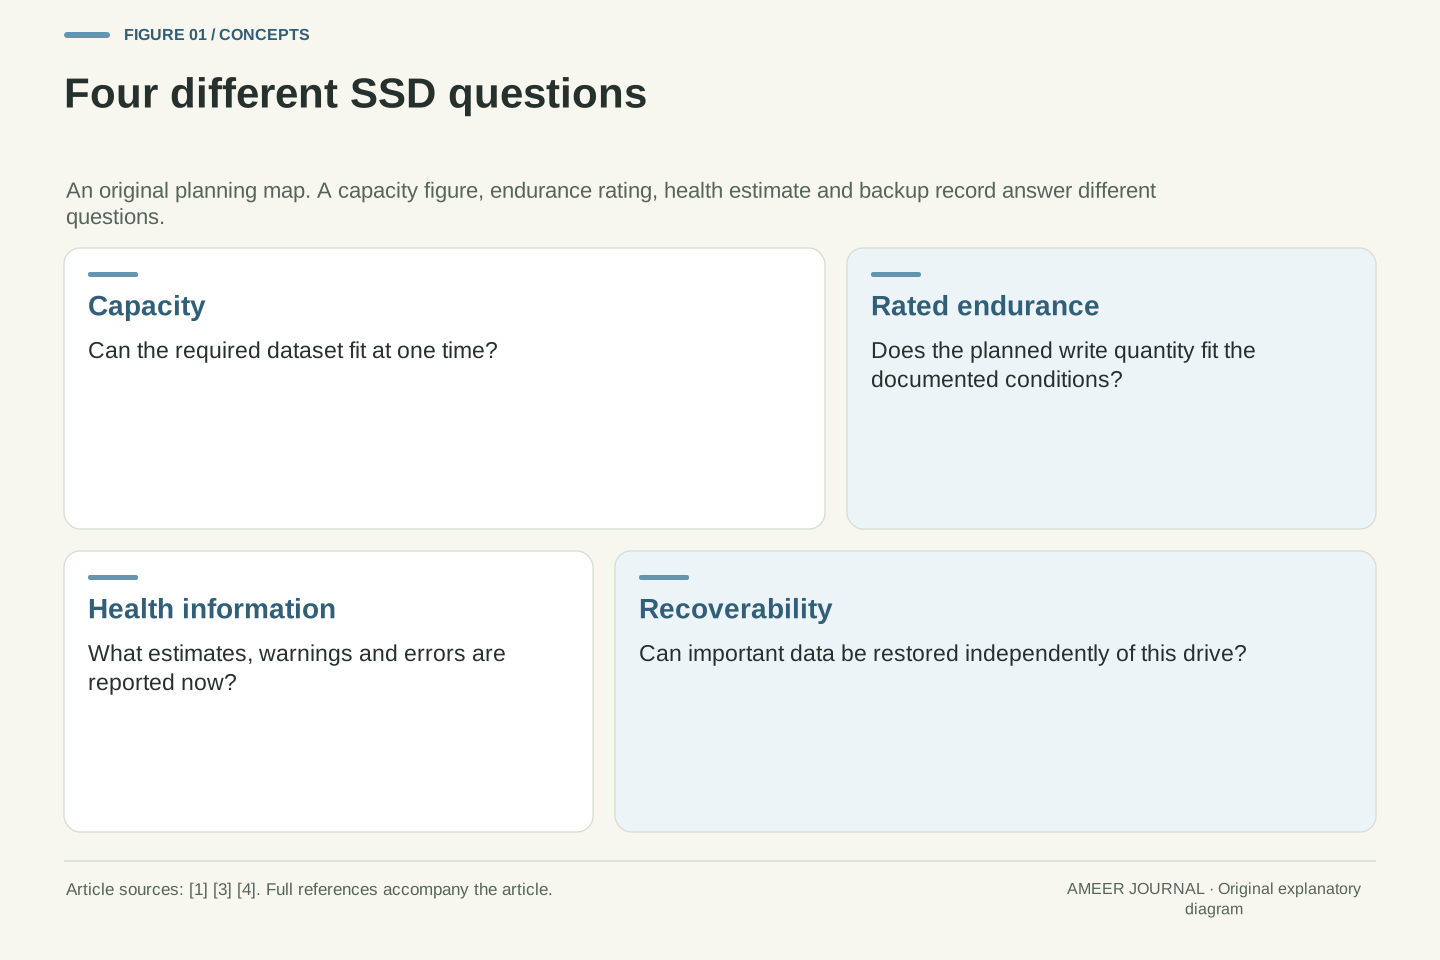
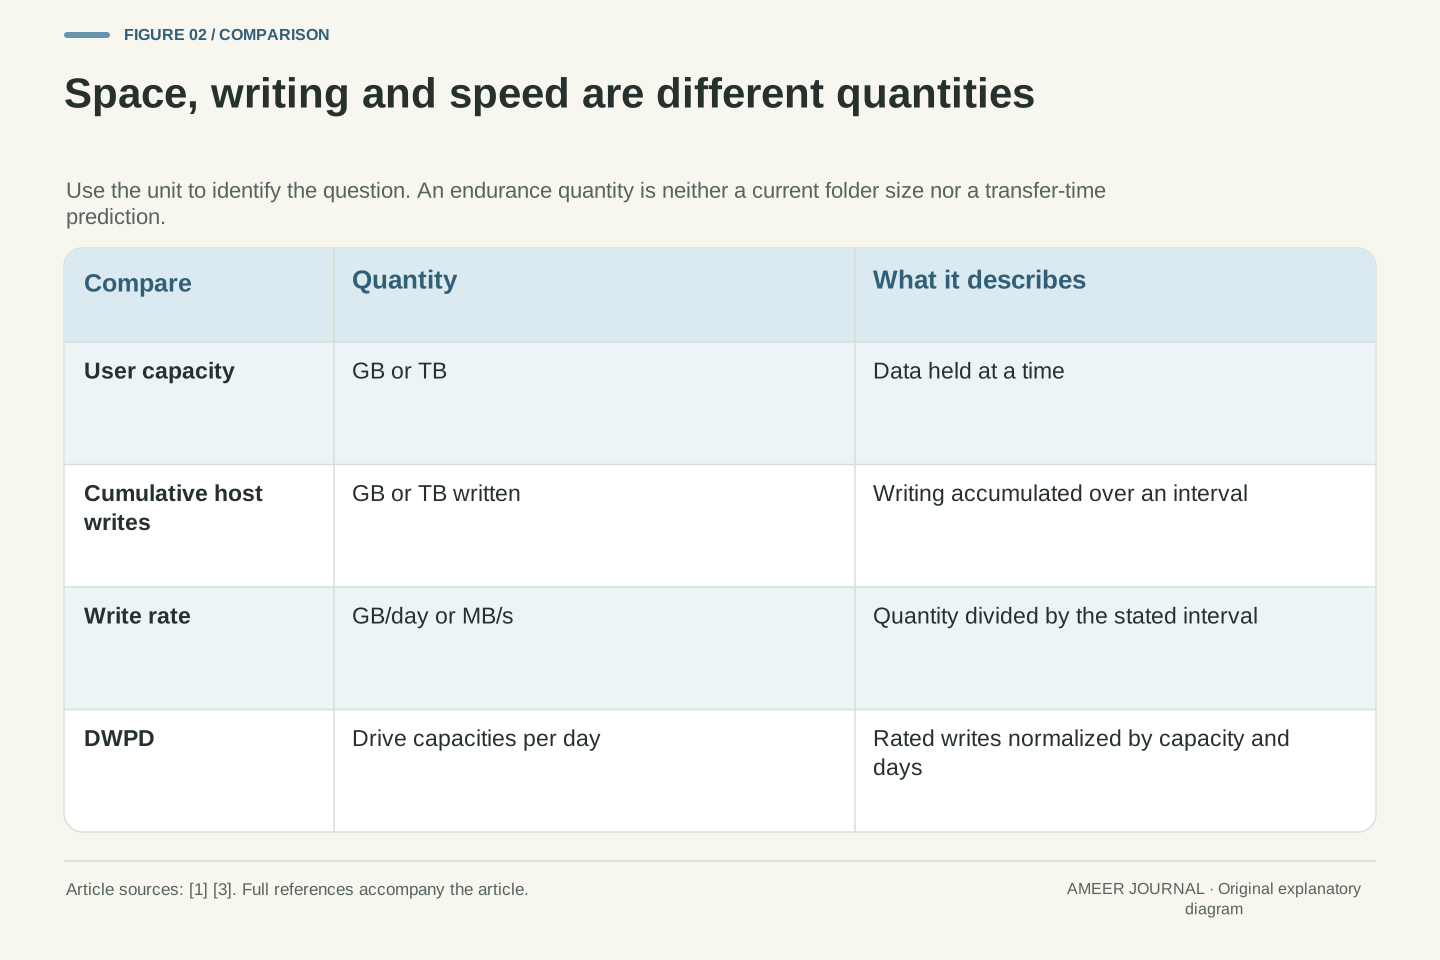
An SSD can have enough space for your files and still face a demanding amount of repeated writing. Capacity answers how much the drive holds at a time. An endurance rating helps answer a different question: how much writing the specified drive is rated to handle under its stated conditions. Kingston distinguishes total terabytes written, or TBW, from drive writes per day, or DWPD [1]. Neither number is a stopwatch counting down to an exact failure date, and neither is the drive's transfer speed.
Imagine choosing storage for a small editing workstation. Most finished projects are moved elsewhere, so the drive rarely looks full. Yet temporary files and repeated exports may make its write workload different from the final folder size. This is a hypothetical planning problem, not a claim about an application we tested. The useful next step is to describe writes over time, then compare that workload with a matching endurance rating. We will also keep warranty conditions and health reports separate. Those three records can inform a decision without pretending that any one of them guarantees the safety of the files.
SSD capacity, throughput and write endurance describe different dimensions. TBW expresses a rated cumulative write quantity; DWPD normalizes that quantity by user capacity and a stated time interval. Kingston's endurance explanation gives that relationship explicitly [1]. A selection decision therefore needs a workload model and the manufacturer's measurement boundary, rather than a comparison of isolated marketing numbers. A remaining write allowance is not equivalent to remaining calendar life.
Our original planning scenario concerns a workstation whose retained dataset is modest but whose application repeatedly produces temporary output. No measured trace or product test is claimed. The analysis asks whether a proposed host-write workload fits a stated rating, then separately asks what warranty terms and health telemetry establish. Separating those questions prevents a capacity screenshot, a healthy-looking status badge or a long warranty period from becoming a substitute for the write budget. The worked examples use decimal gigabytes and terabytes, explicit 365-day years and invented values; they are calculations to check, not forecasts for a named SSD.
Host writes and internal flash work are different boundaries
The computer sends writes to the SSD, but the drive may also move existing data while managing its flash memory. Kingston describes garbage collection using reserved space to combine valid data and reclaim blocks. It also identifies write amplification as extra internal work associated with a workload [2][5]. Therefore, the amount written by the computer and the total work inside the flash are related, but they are not automatically the same number.
That distinction matters when comparing a measurement with a specification. Kingston's discussion of TBW identifies the host-data boundary, and explains that workload differences can affect the flash's internal work [5]. If your utility reports host writes, do not multiply the value by a guessed amplification factor and then compare it with a host-write rating as though both sides still meant the same thing. First establish what the rating and the tool actually count. Your task is to compare compatible quantities. The controller's internal efficiency remains relevant, but an invented multiplier cannot reveal it for your particular drive.
The host interface and NAND media are distinct accounting boundaries. Garbage collection and valid-data relocation can require internal writes beyond the payload submitted by the host. Kingston's over-provisioning explanation describes the controller workspace used to reclaim invalidated blocks, while its enterprise/client discussion identifies TBW in terms of host data and notes workload-dependent write amplification [2][5]. A host-write total is consequently not a direct measurement of all NAND programming activity.
Avoid double-counting internal amplification in a budget based on a host-write endurance rating. If both the observed counter and the manufacturer's TBW use the host boundary, compare those quantities directly while preserving the rating's workload assumptions. Applying an arbitrary WAF to the measured host total changes the numerator's boundary without changing the denominator. Conversely, a vendor-specific NAND-write counter cannot be treated as host writes merely because both values are expressed in terabytes. Identify the field, its units and its documented meaning before calculating. This boundary check is more valuable than a detailed-looking model whose inputs refer to different kinds of writes.
DWPD changes when capacity or the time window changes
DWPD expresses writing as a fraction of a drive's capacity each day over a specified period. To convert a TBW rating, divide the total write quantity by the number of days and the drive capacity, keeping the units consistent. Kingston publishes this calculation using warranty years, 365 days per year and capacity in gigabytes [1]. The time period is part of the number; leaving it out makes comparisons unreliable.
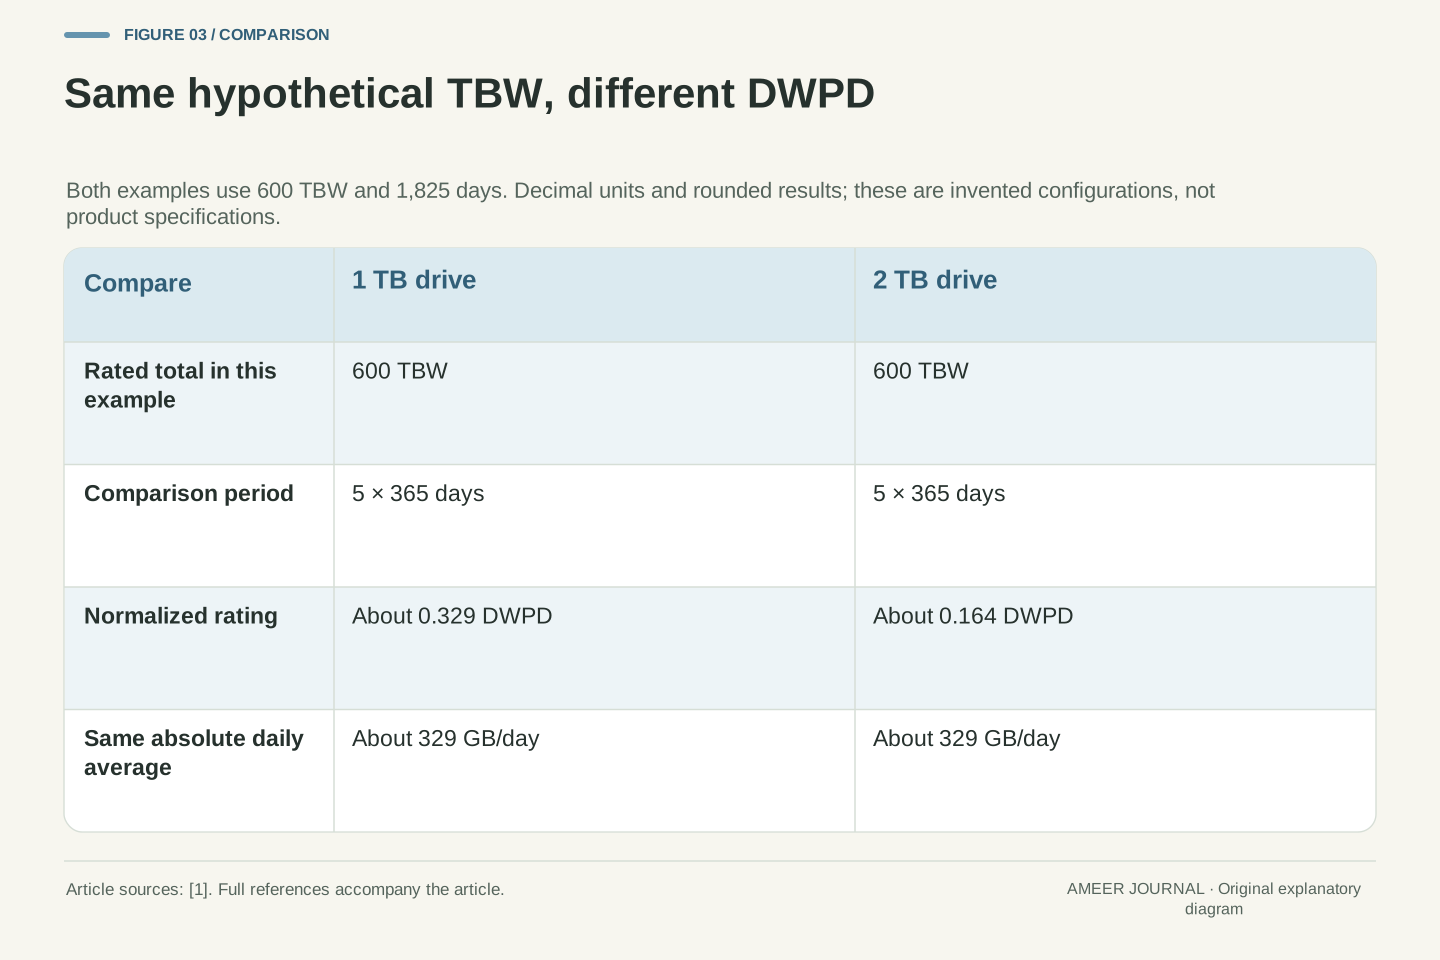
Take two hypothetical drives with the same 600 TBW rating and a five-year comparison period. One holds 1 TB and the other holds 2 TB. Using 1,825 days, the first works out to about 0.329 DWPD and the second about 0.164 DWPD. Both still represent about 329 GB of host writes per day when the same total rating is spread evenly across that period. The larger drive's lower DWPD does not make its absolute write allowance smaller in this example. It means that the same daily quantity fills a smaller fraction of a larger capacity. Actual product ratings must still be checked separately.
For consistent decimal units, DWPD = rated TBW / (user capacity in TB × days). Using Kingston's 365-day convention, a five-year comparison has 1,825 days [1]. The normalization is useful, but capacity and duration are part of its denominator. A bare DWPD value cannot establish an absolute host-write allowance unless those inputs are known. It also does not specify a maximum instantaneous write rate or require a perfectly uniform daily workload.
The hypothetical 1 TB, 600 TBW drive yields 600/(1×1,825)=0.32877 DWPD. Holding TBW and duration fixed while changing capacity to 2 TB yields 0.16438 DWPD. In both cases 600/1,825=0.32877 TB/day, approximately 329 decimal GB/day. This controlled comparison varies only capacity; it is not a statement that real 1 TB and 2 TB models share ratings. Comparing drives solely by their normalized DWPD can therefore obscure an equal absolute allowance. For a workload expressed in GB/day, convert both products back to that boundary and retain their actual rating conditions. When products use different warranty durations, keep each published calculation visible alongside any comparison over your chosen planning interval.
Measure writes over a representative interval
A useful baseline needs two readings from the same drive, taken at known times. Subtract the earlier cumulative host-write total from the later one, then divide by the elapsed days. Include normal busy and quiet work rather than choosing one convenient afternoon. This is an original observation method based on the cumulative counters, not a test performed for this article. Microsoft's NVMe health-log documentation describes host data-written counters separately from the number of write commands [3]. Counting commands alone does not tell you how much data was written.
Check the unit before doing the subtraction. In the documented raw NVMe field, the count represents thousands of 512-byte data units, with rounding. A normal drive utility may already convert that into gigabytes or terabytes [3]. Do not apply the raw conversion a second time to a value already labelled TB. Keep the model, capacity, utility name, dates and displayed units beside your readings. Also record whether the measurement covered the whole intended device. An unexplained number copied from a screenshot is a weak foundation for deciding whether the next several years of work will fit.
Estimate a baseline as the delta of a documented cumulative host-write counter divided by elapsed wall-clock days. The interval should contain representative operations and their frequency. Microsoft documents DataUnitWritten separately from HostWrittenCommands: one counts data quantity and the other counts completed write commands [3]. Differences in request size make those quantities noninterchangeable. This proposed sampling method does not establish that any particular monitoring utility or system configuration has been tested here.
For the raw NVMe field documented by Microsoft, each increment represents 1,000 units of 512 bytes, or 512,000 bytes, with rounding of the reported cumulative value [3]. Thus an illustrative increment of 1,000 corresponds to approximately 512,000,000 bytes, or 0.512 decimal GB. That example is a unit conversion, not an observed workload. Utilities may already scale the raw field, and SATA/vendor-specific attributes need their own definitions. Record the device and reporting scope; do not mix counters from different drives or assume a namespace-specific view exists. Preserve original readings so a later correction to units does not require inventing replacement observations.
Model the workload that is coming, not only the workload today
A baseline describes the interval you observed. It does not know that you plan to start recording longer videos, keep more local caches or move another workload onto the drive. Build a simple list of recurring jobs and ask how often they will run. Keep that list separate from the drive's capacity requirement. Kingston's workload discussion explains why differences in writing behavior matter to endurance estimates [2][5]. A different application pattern is a reason to revisit assumptions, not just change a folder-size estimate.
For the hypothetical workstation, suppose the plan is an average of 100 GB of host writes per day for two years, followed by 400 GB per day for three years. Those numbers are invented and include the whole daily write workload, not only finished project files. The next section calculates their combined quantity. A busy day can exceed an evenly averaged allowance without that alone proving failure; what matters to this cumulative comparison is the total within the defined period. Performance during the busy day is a separate question. Neither a five-year average nor a TBW number predicts whether an urgent export will finish quickly.
A workload model should preserve both accounting scope and its time dependence. A representative measured baseline can inform the first phase, while planned changes require explicit assumptions for later phases. Kingston's endurance discussion notes that real workload behavior and write amplification can differ from the workload used to establish a rating [2][5]. Consequently, a host-write projection is a planning comparison under stated conditions, not a complete physical degradation model.
Define the hypothetical future schedule as 100 decimal GB/day for two 365-day years, then 400 GB/day for three such years. Each rate includes all host writes attributable to the drive in that phase. Do not add a second estimate of temporary files if they were already included in the observed or assumed host total. Likewise, do not replace a bursty workload with a daily average when evaluating latency or sustained throughput. The average is useful for the cumulative endurance budget; performance acceptance still requires the relevant task and conditions. This separation keeps the model simple without pretending that one scalar describes every requirement.
Calculate the budget before discussing headroom
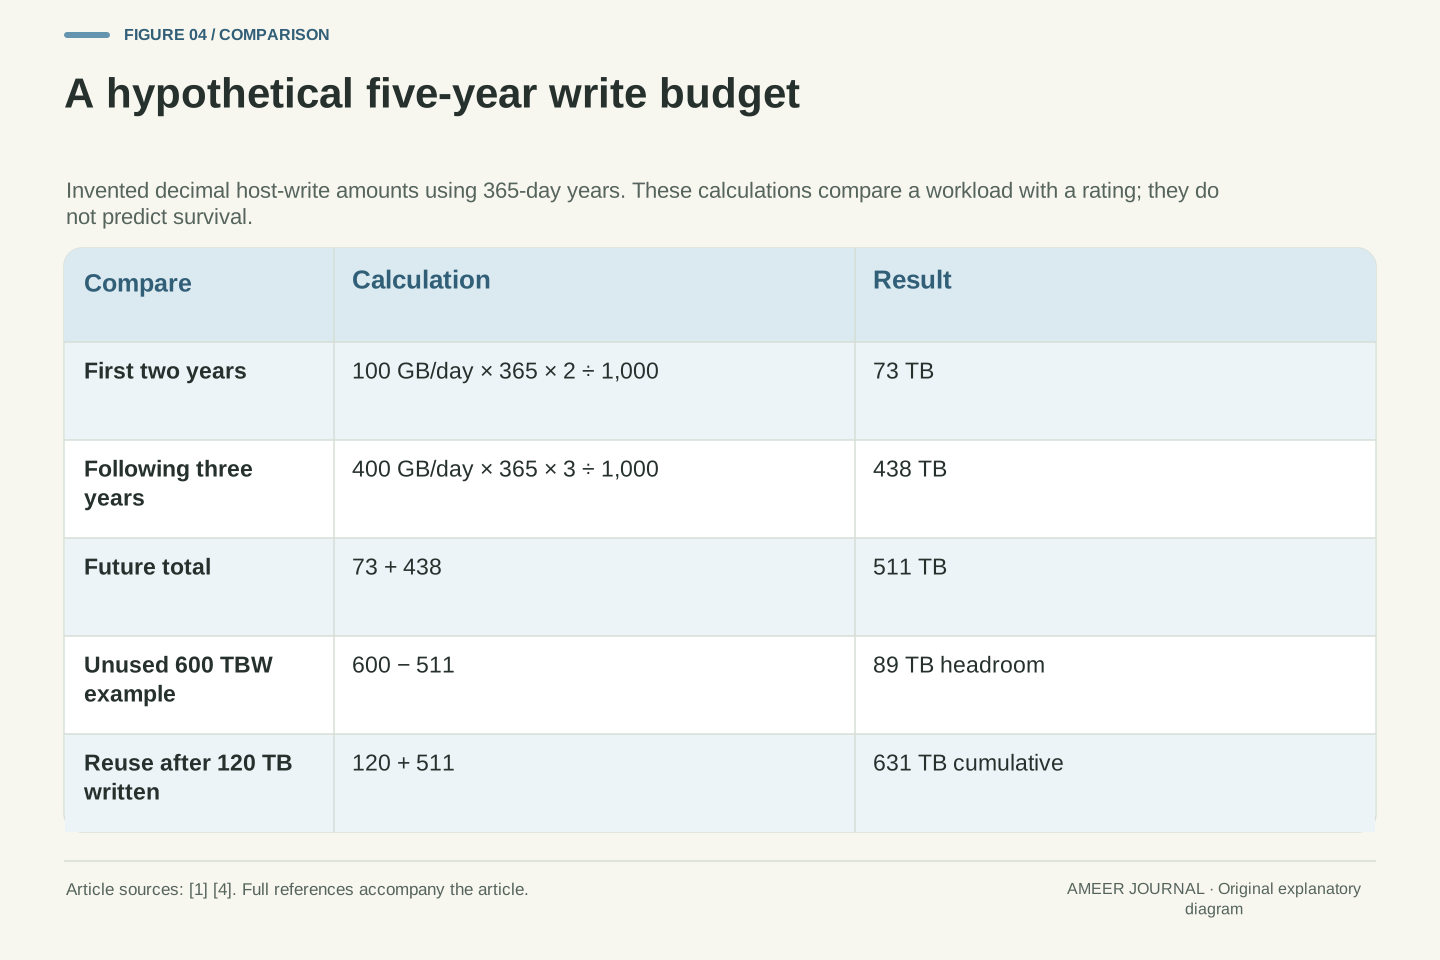
Using the invented schedule, the first phase writes 100 GB × 365 × 2 = 73,000 GB, or 73 TB. The second writes 400 GB × 365 × 3 = 438,000 GB, or 438 TB. Together they total 511 TB. Against a hypothetical new drive rated at 600 TBW under the relevant conditions, the arithmetic difference is 89 TB. We have used 1,000 GB per TB and deliberately ignored leap days. These are teaching assumptions, not measured writes or a promise that a drive will survive the schedule.
Now change only the starting history: imagine reusing a drive whose comparable host-write total already shows 120 TB. The same future schedule would take the cumulative quantity to 631 TB, which is 31 TB above the example rating. That does not predict a failure on the day the counter crosses 600. It shows that this plan no longer fits inside that stated cumulative allowance. The reused drive's remaining warranty time also needs a separate check; reuse does not restart it. Explicit arithmetic makes these limits visible before optimistic language such as plenty of life left takes over [1][4].
Compute the two hypothetical phases in decimal units: W1=(100×365×2)/1,000=73 TB and W2=(400×365×3)/1,000=438 TB. Future host writes are therefore 511 TB. For an unused 600 TBW example, nominal arithmetic headroom is 600−511=89 TB. The calculation assumes 365-day years, the same host-write boundary and applicability of the stated rating conditions. It neither models NAND-cell degradation nor supplies a probability of successful service. The formula connects to the rated-write interpretation and duration conventions described by the manufacturer [1].
With 120 TB already recorded at the comparable boundary, the same future plan becomes 120+511=631 TB, exceeding the example rating by 31 TB. This is an assumption change, not a benchmark result. It identifies a workload/rating mismatch and should prompt a revised plan or product requirement; it does not identify an exact physical failure threshold. Warranty eligibility additionally depends on the actual product's time and other conditions, which do not reset when the drive changes jobs [4]. Avoid choosing a universal safety-margin percentage from this exercise: uncertainty in workload growth and rating applicability must be evaluated for the actual use.
Read the warranty as a separate record
A warranty may end when either a time limit or a write limit is reached. Samsung's published internal-SSD warranty page explicitly uses the stated period or TBW, whichever comes first [4]. This is one manufacturer's documented policy, not a rule to assume for every brand or a statement about all legal rights in every country. Check the exact product and the terms that apply where it was purchased.
Save the model, capacity, purchase record and applicable warranty document with your plan. A five-year label does not mean you can ignore its write condition. Equally, being below the write condition does not extend an expired time period. Most importantly, replacement coverage is not the same thing as restoring your files. Samsung's cited terms exclude data-recovery costs and advise backing up important data [4]. Maintain recoverable copies because the cost of losing work is a different problem from the cost of replacing a piece of hardware. Do not let a favourable TBW comparison become a reason to postpone that protection.
Warranty terms are a contractual record distinct from endurance modelling and health telemetry. Samsung's internal-SSD page specifies coverage by period or TBW, whichever is reached first, with model/capacity-specific entries and additional conditions [4]. The claim here is restricted to that published manufacturer policy; it is not an interpretation of statutory consumer rights or a universal assertion about other vendors. The applicable region, seller conditions and exact model need their own documentation.
A procurement or reuse record should preserve purchase date, capacity, product identity, the relevant terms and the workload budget. This allows the time and write conditions to be evaluated independently. Remaining rated writes cannot silently extend the time term, and an unused calendar period does not remove a write limit. The same Samsung document excludes data-recovery costs and calls for important data to be backed up [4]. Therefore, hardware remedy and recoverability must be planned separately. A backup/restore process is an operational requirement; the endurance calculation neither implements it nor verifies that a saved copy can actually be restored.
A health percentage is not a calendar forecast
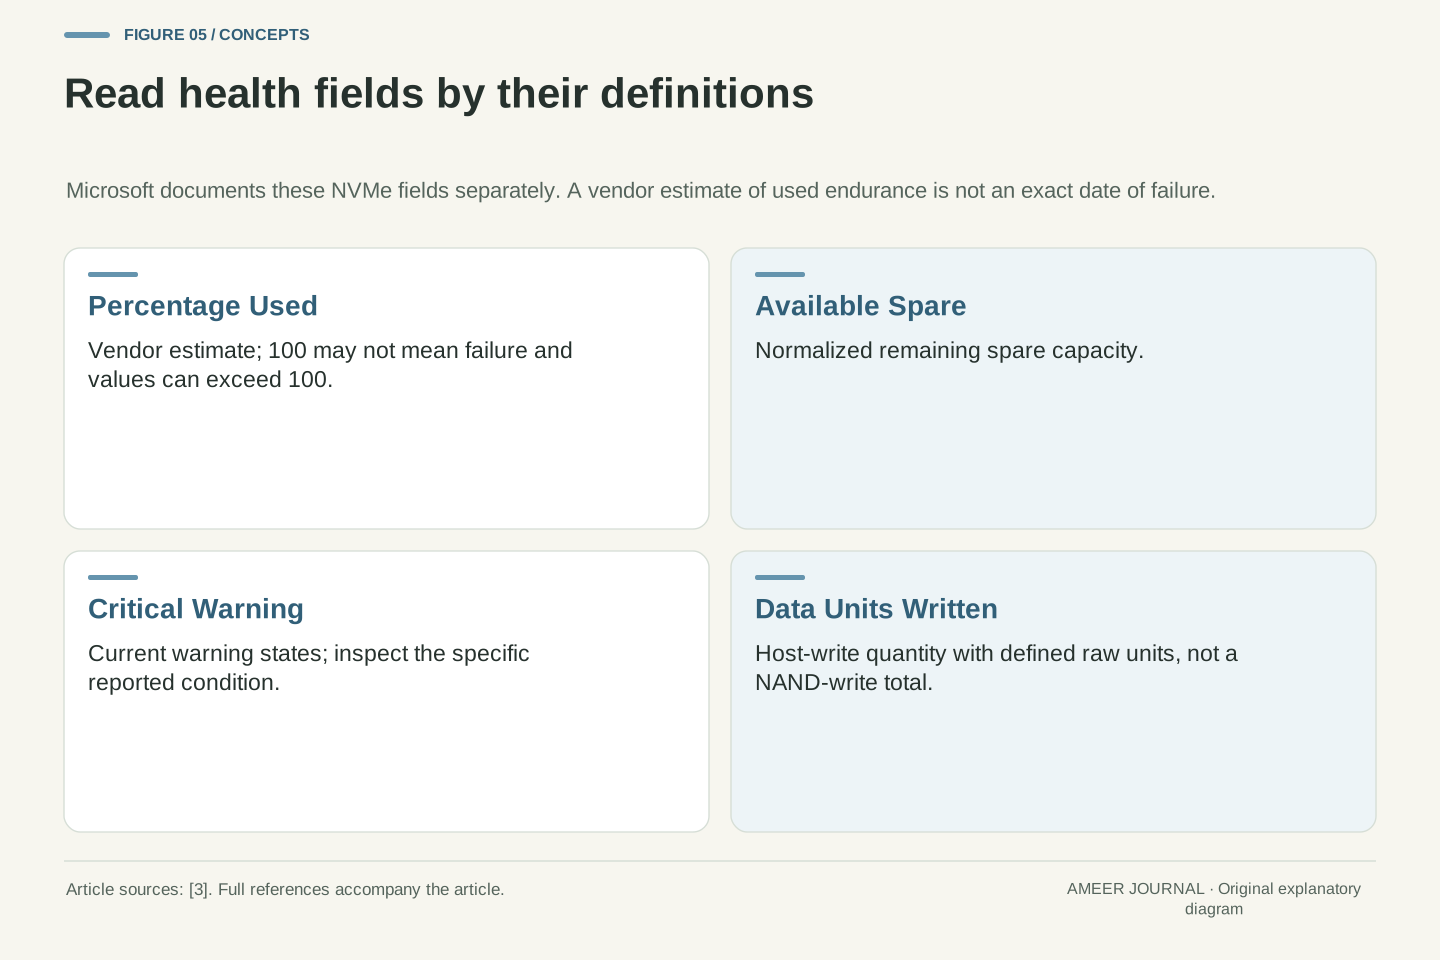
A monitoring utility may show life used or life remaining. Read what the underlying field means before treating it as a countdown. Microsoft's NVMe health documentation defines PercentageUsed as a vendor-specific estimate based on actual use and the manufacturer's prediction of media life. It says that 100 means the estimated endurance has been consumed, but may not mean the device has failed; the value can exceed 100 [3]. That is very different from a guaranteed appointment with failure.
The same documentation has separate fields for available spare capacity, media-related errors and critical warnings [3]. One reassuring percentage cannot replace those other signals, and a warning deserves attention even if the endurance-used figure looks small. Use the supported manufacturer's tool and its explanation for your drive. Keep snapshots over time, preserve important data and follow the documented response to warnings. Do not convert ten percent used into a claim of exactly nine times the elapsed life remaining. Workload changes, vendor estimation and other failure mechanisms make that a stronger conclusion than the field establishes.
PercentageUsed is a vendor-specific estimate of consumed NVM endurance in the NVMe health-log interface documented by Microsoft. A value of 100 marks consumption of the estimated endurance, may not indicate subsystem failure and is permitted to be exceeded [3]. It is not defined as a probability that the drive will fail, a calendar expiry or a simple ratio of host TBW to a published warranty limit. Treating these different quantities as synonyms overstates the telemetry.
AvailableSpare reports a normalized spare-capacity quantity, while CriticalWarning represents current warning states and media-error fields report other information [3]. Their semantics differ, so a single application badge cannot be assumed to summarize every risk. Interpret the precise drive/tool combination and follow supported response guidance when warnings occur. For trend review, record the field names, units, reporting time and configuration; retain the original values rather than replacing them with a guessed lifespan. A changing workload can invalidate a time extrapolation even if the estimate itself is behaving as designed. This article offers no failure prediction for an individual drive.
Reserved space helps the controller but does not renew a rating
Over-provisioning means flash capacity reserved for the SSD controller rather than ordinary user files. Kingston explains its use as workspace for garbage collection and management of empty blocks, and discusses how this can affect performance and endurance under its documented workloads [2]. It is a real mechanism, but it is not a universal promise that leaving a particular percentage empty will multiply every drive's lifespan by the same amount.
Keep product-supported management separate from improvised changes. Some drives expose an over-provisioning setting; other products have different controls or fixed arrangements. Check the exact manufacturer's instructions before changing capacity or partitions, and preserve data first. Ordinary free filesystem space and controller-reserved capacity should not be treated as identical merely because both look unused to the person managing files. The article's 600 TBW example does not become a new, larger manufacturer rating when you change a local setting. Such a change needs its own documented meaning and a fresh workload/performance assessment; it is not a way to erase already accumulated writes.
Controller over-provisioning reserves capacity outside the normal user-addressable space. Kingston describes its role in garbage collection, valid-page relocation and maintaining available blocks, and provides workload-specific enterprise examples [2]. Those mechanisms explain why occupancy, controller behavior and write pattern matter. They do not establish a universal quantitative benefit for a different controller, NAND configuration or workload, so no generic multiplication of TBW is justified here.
Distinguish factory-reserved capacity, a supported configurable reservation and ordinary free filesystem space. The interaction with deallocation and garbage collection depends on the documented stack; a filesystem screenshot alone does not reveal controller-reserved resources. This article does not prescribe repartitioning, a universal free-space percentage or a procedure to alter device firmware. If a manufacturer supports a setting, evaluate its capacity/performance consequences and data-preservation instructions before changing it. The rating used in the workload budget remains the documented applicable rating, not a number invented by the owner. Nor does changing the allocation reset cumulative host writes or the original warranty clock.
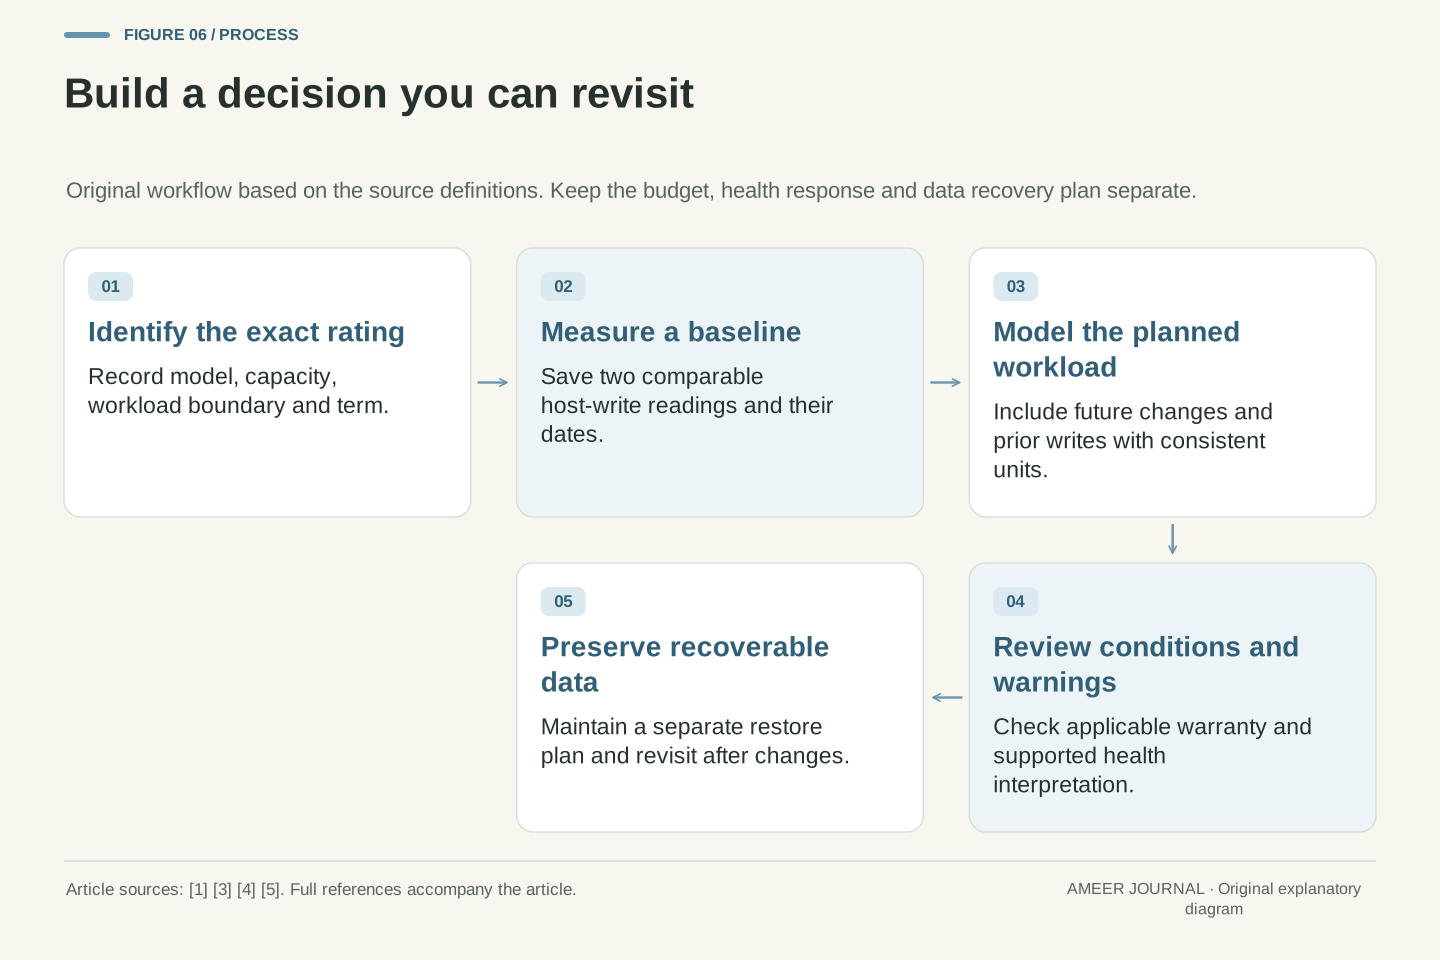
Make the decision with three records, not one badge
A useful SSD decision keeps three records together. First, the exact model's endurance rating and its measurement conditions. Second, a write-workload estimate with clear units, time periods and planned changes. Third, the actual health and warranty information. Kingston's endurance definitions, Microsoft's separate health fields and Samsung's stated warranty conditions support keeping those questions distinct [1][3][4]. None of them claims that an individual drive cannot fail while its paperwork looks reassuring.
For the hypothetical workstation, the decision is now explainable. A new 600 TBW example has 89 TB of arithmetic headroom against the invented 511 TB plan; a drive already at 120 TB does not fit that same plan inside the example cumulative rating. Real selection still needs the required capacity, compatibility and performance, plus a recoverable copy of important data. Recheck the budget after a substantial workload change and investigate documented health warnings. This gives you something more useful than a promised number of years: a set of assumptions you can inspect, measurements you can update and a plan that does not depend on predicting the exact moment hardware fails.
The practical output is a traceable workload-to-rating comparison with independent health and warranty records. Start with the model/capacity-specific host-write rating, normalize its time and capacity units only where useful, then compare the planned cumulative host quantity. Preserve the uncertainty introduced by workload changes and the rating's reference conditions. Health estimates and critical-warning fields answer separate questions, while coverage follows the actual terms [1][2][3][4]. A clean comparison is evidence for a planning decision, not a reliability certification.
For our invented schedule, the checked quantities are 73 TB plus 438 TB, or 511 TB of future writes. The 600 TBW unused example has 89 TB of nominal headroom; adding 120 TB of prior writes produces a 31 TB excess. These figures must remain labelled hypothetical wherever reused, including in diagrams. In practice, retain original counters and dates, document the selected assumptions and revisit them when the workload changes. Verify recoverability separately. The method supports an honest decision about fit and maintenance without confusing rated endurance, current warning state, warranty coverage and the unobservable exact date of future failure.
Sources & further reading
Explore the references behind this guide. External pages may change after our review.
- Understanding SSD Endurance: TBW and DWPD - Kingston TechnologyKingston Technology · Accessed 6 Nov 2026
- SSD Over-provisioning (OP) - Kingston TechnologyKingston Technology · Accessed 6 Nov 2026
- NVME_HEALTH_INFO_LOG - Win32 apps | Microsoft LearnMicrosoft · Accessed 6 Nov 2026
- SSD Product Warranty | Support | Samsung Semiconductor GlobalSamsung Semiconductor · Accessed 6 Nov 2026
- The Difference Between Enterprise & Client SSD - Kingston TechnologyKingston Technology · Accessed 6 Nov 2026
Article updated 6 Nov 2026.
Found something we should revisit?
Good explanations get better with thoughtful feedback.