What you’ll take away
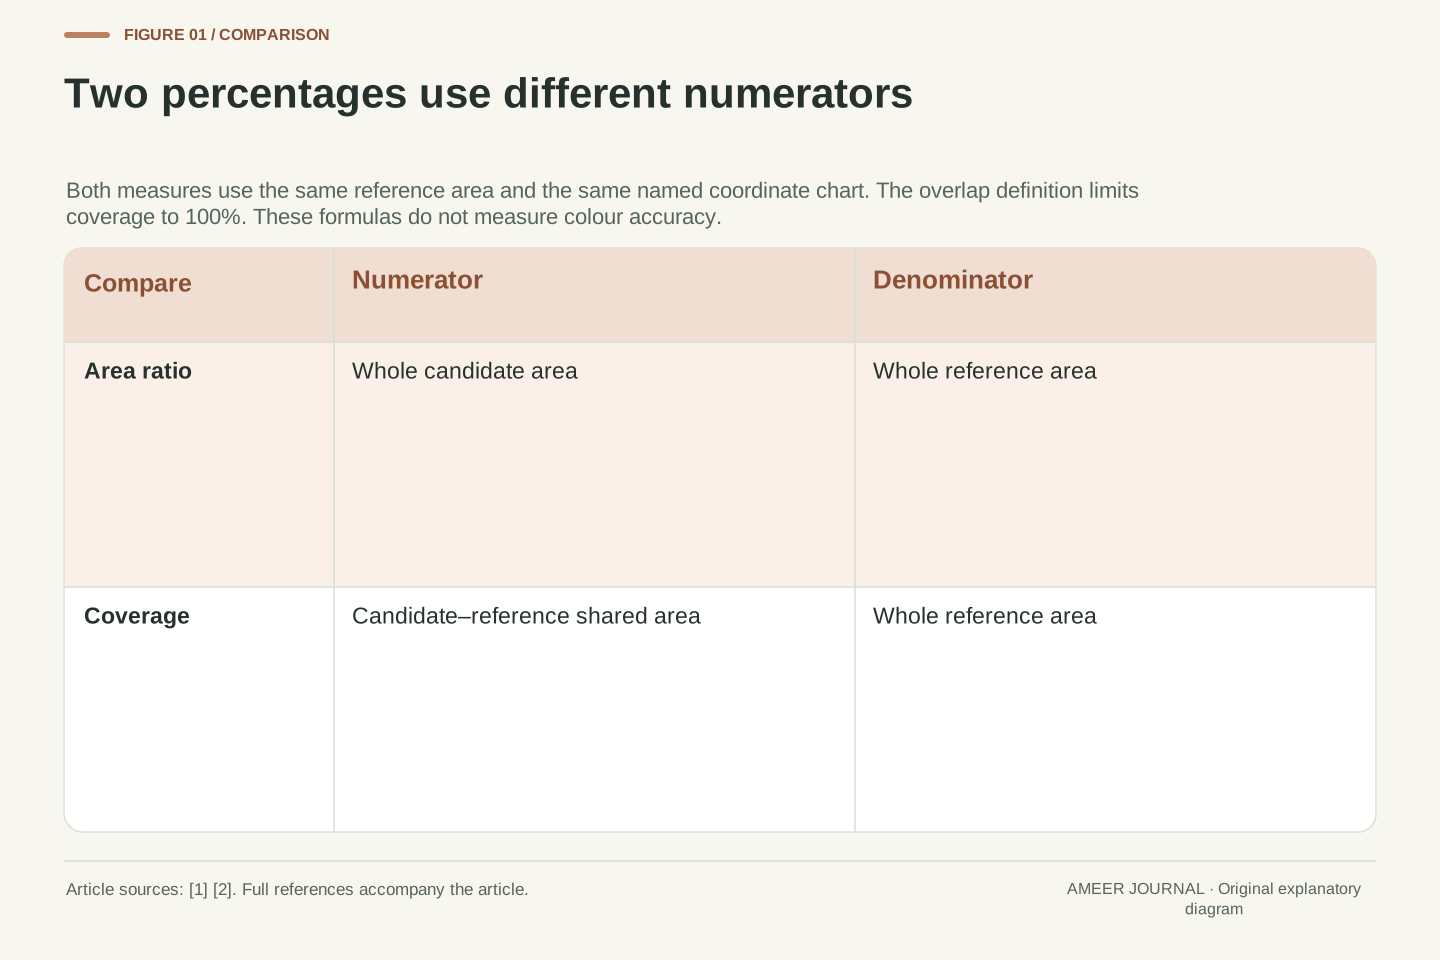
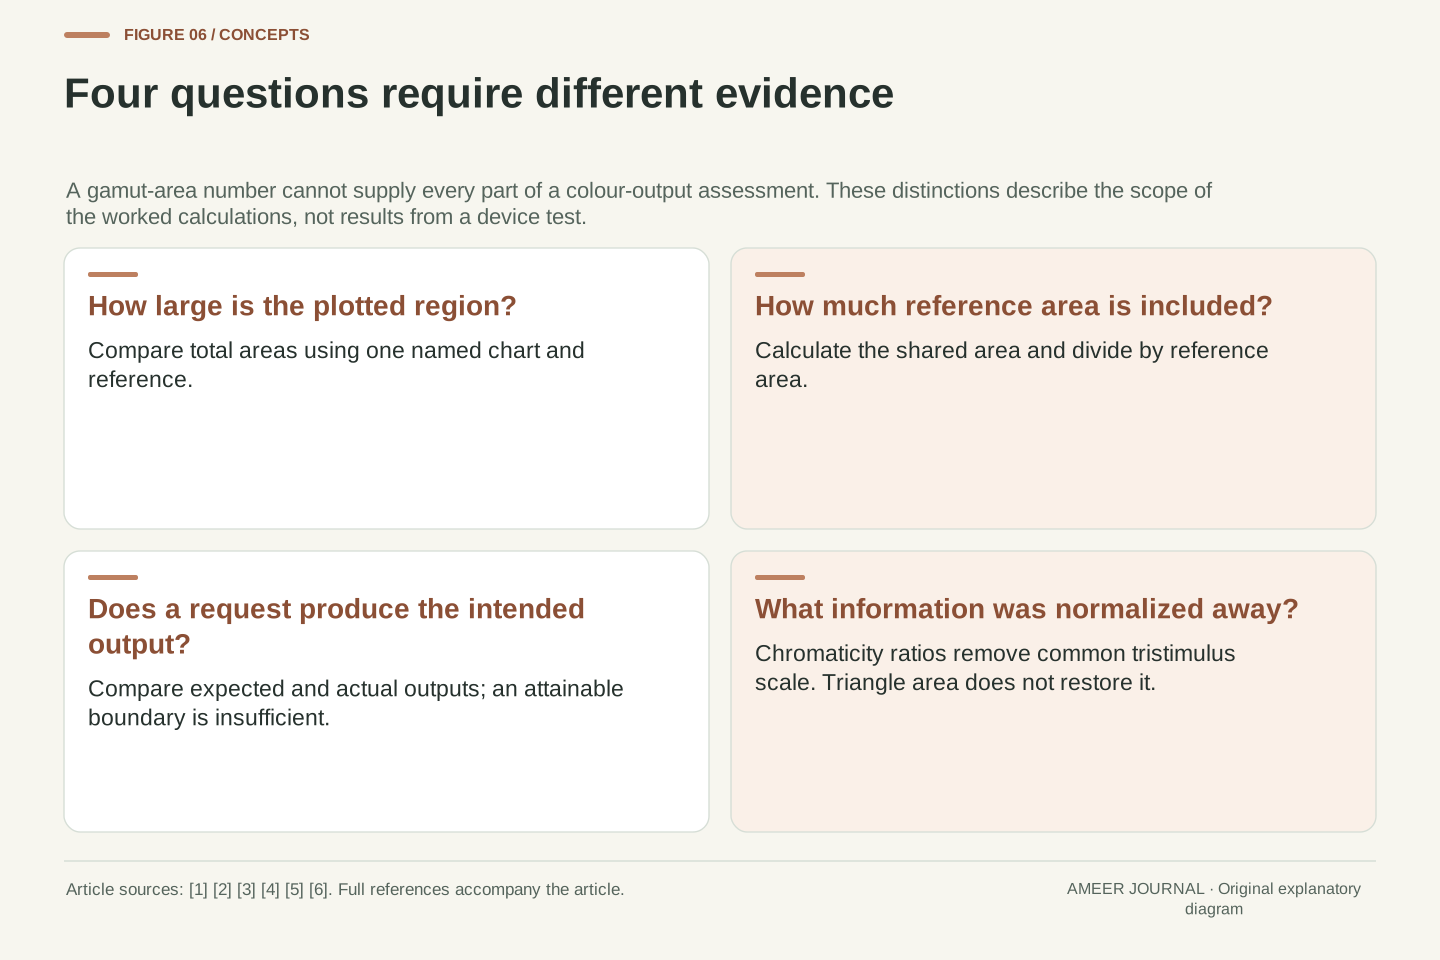
- Area ratio compares total candidate area with reference area; coverage compares only their shared area with the reference.
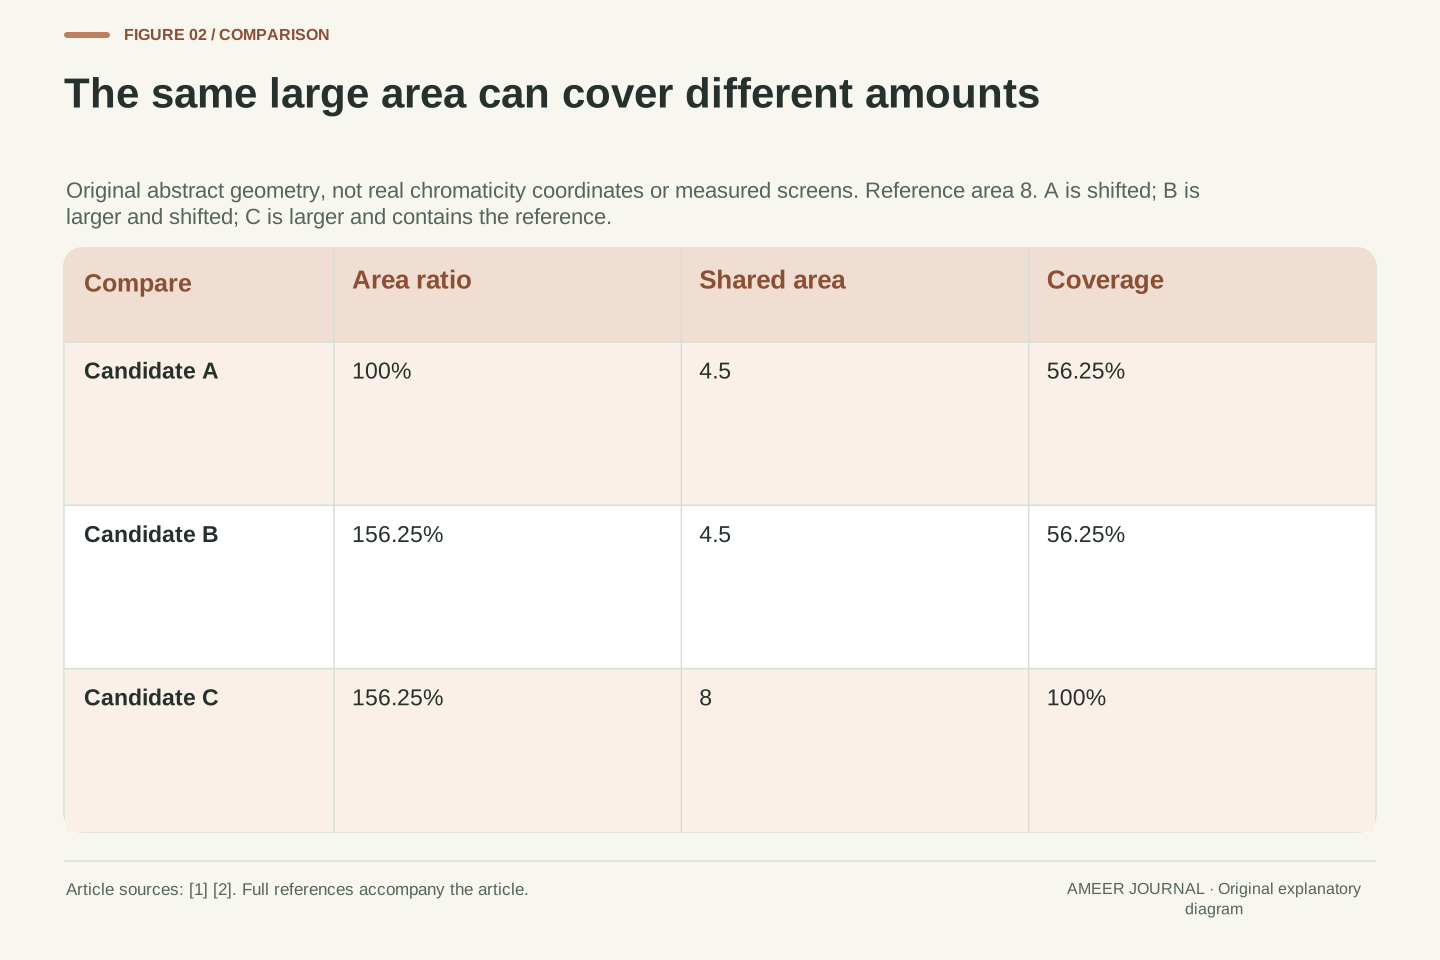
- In the original abstract example, two candidates both have 156.25% area ratios but cover 56.25% and 100% of the reference.
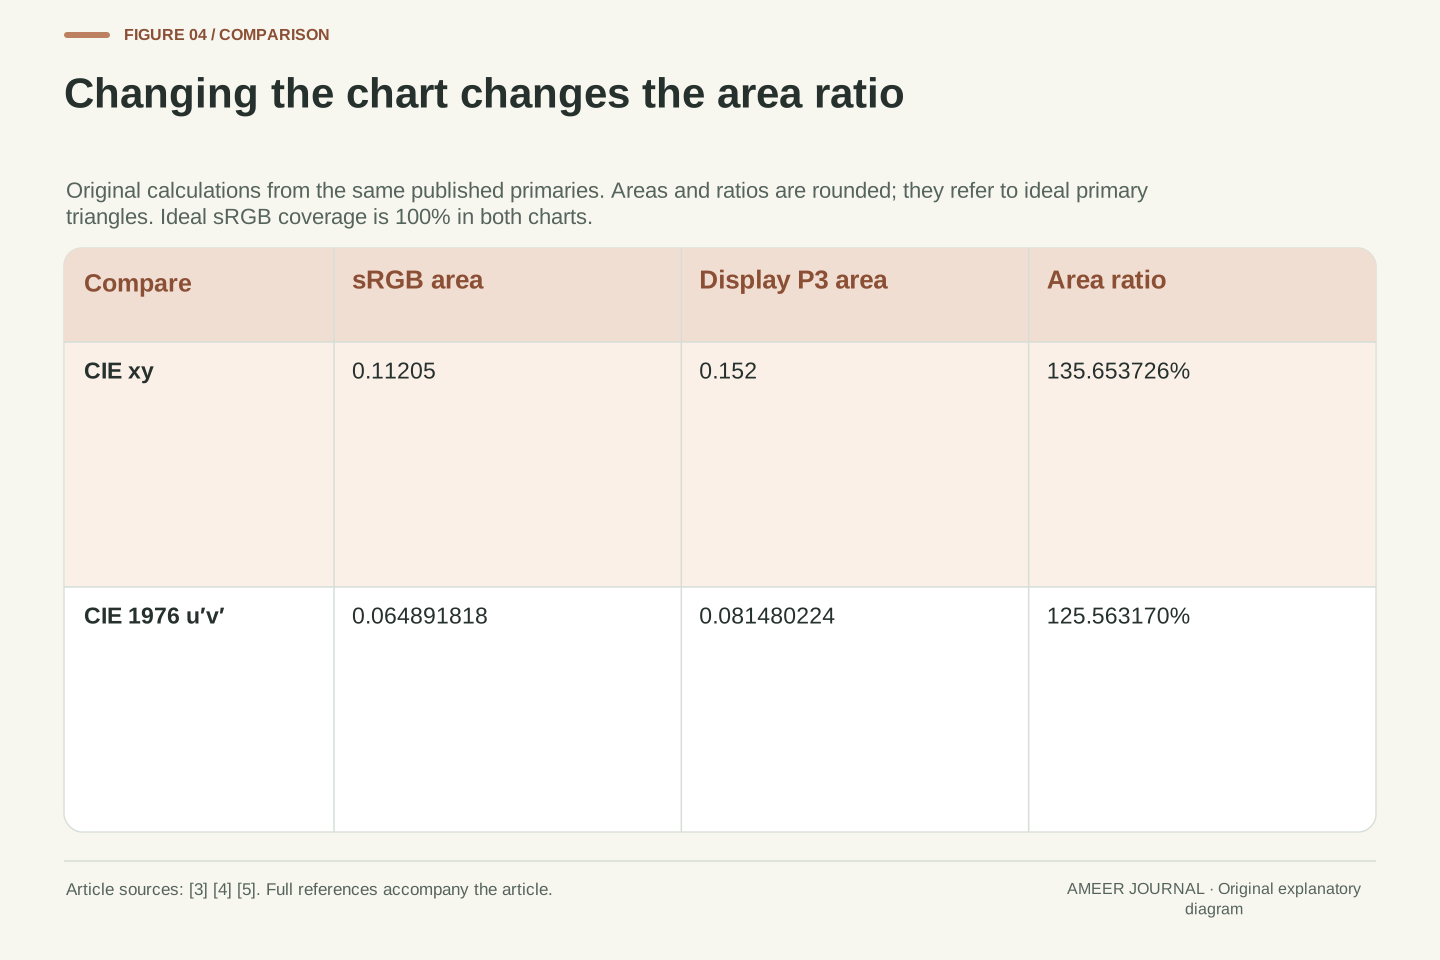
- Using the published ideal primary coordinates gives a Display P3/sRGB area ratio of about 135.65% in xy and 125.56% in CIE 1976 u′v′.
- The ideal sRGB triangle is fully contained in the ideal Display P3 triangle in both calculations; this is checked separately from area.
- Chromaticity normalization removes common tristimulus scale, so a triangle area does not describe full output volume or bit depth.
- Coverage of an attainable range does not by itself verify the accuracy of the request-to-output mapping.
What does the percentage actually compare?
A display specification says its colour gamut is larger than a familiar reference gamut. Does that mean it can reproduce every colour inside the reference? The percentage alone cannot answer. A shape can be large because it extends far in one direction, while leaving a gap somewhere else. That difference matters whenever a total-size claim is read as a coverage claim.
Manufacturer explanations from EIZO and BenQ distinguish gamut area ratios from reference-gamut coverage [1][2]. We will make that distinction concrete with three small geometry examples. Their coordinates are invented teaching values, not measurements of a monitor or physically meaningful colour coordinates. After those examples, we will calculate two percentages from the published sRGB and Display P3 primary coordinates [3][4].
There is a second question behind the first: which chart supplied the areas? The same ideal primary triangles produce different area ratios in two named chromaticity charts. That does not require a display to change. It requires us to change the coordinate system used to calculate the percentage.
A gamut percentage is incomplete without its reference set, coordinate representation and measure. This article distinguishes a candidate-to-reference planar area ratio from the fraction of reference area lying in their intersection. The terminology distinction appears in manufacturer explanations [1][2]; the counterexamples and calculations here are original.
Scope is two-dimensional chromaticity geometry. We first use abstract triangles whose coordinates are deliberately unrelated to physical chromaticities. We then use the ICC registry’s sRGB and Display P3 primaries and the CIE definition of the 1976 u′v′ transformation [3][4][5]. These are calculations on ideal encoding definitions, not measurements of a panel, projector, colour-management pipeline or human observer.
Keeping those two examples separate prevents a common evidential jump. A mathematical counterexample can disprove an implication about area and containment without establishing the behaviour of a particular display. Likewise, reproducing an encoding’s primary-triangle area does not verify that a product reaches those primaries or maps image values accurately.
Area and coverage use different numerators
Imagine drawing a reference shape on transparent paper and laying a candidate shape over it. To find the area ratio, compare the whole candidate shape with the whole reference shape. To find coverage, compare only their shared area with the whole reference. The denominator stays the same; the numerator changes. This is the distinction behind the terminology used in the cited explanations [1][2].
Suppose the reference area is 8 square units and the candidate area is 12.5. The area ratio is 12.5 divided by 8, multiplied by 100: 156.25%. We still do not know the shared area. If it is 4.5, coverage is 56.25%. If it is the full 8, coverage is 100%. Both situations fit the same total-area percentage.
Under this overlap definition, coverage cannot exceed 100%. An area ratio can. A candidate smaller than the reference also cannot cover all of its area. However, making the candidate at least as large removes only that size obstacle; it does not prove that the shapes line up.
Let R be the reference region, G the candidate and A the ordinary planar area in one specified chart, with A(R)>0. Define r=A(G)/A(R) and c=A(G∩R)/A(R). Percentages are 100r and 100c. The overlap interpretation is consistent with the terminology discussions [1][2]; these symbols and examples are our own.
Because G∩R is a subset of both G and R, 0≤c≤min(1,r). Thus r<1 rules out complete area coverage, while r≥1 supplies no guarantee that c=1. The ratio r does not encode location or shape. Nor does c specify where uncovered regions lie. These are limits of the information in the numbers, independent of a product’s marketing language.
For A(R)=8 and A(G)=25/2, r=25/16. If A(G∩R)=9/2, c=9/16; if the intersection has area 8, c=1. The same r therefore permits different coverage. We use closed convex triangles below, so the intersections and missing regions can be calculated exactly without introducing a measured gamut surface or a numerical sampling approximation.
Equal area can still leave a large gap
Begin with an abstract reference triangle whose corners are (0,0), (4,0) and (0,4). Its horizontal base and vertical height are both 4. A triangle’s area is half its base times its height, so this reference has area 8. Remember that these are ordinary geometry coordinates. They are not points on a real colour chart.
Candidate A has corners (1,0), (5,0) and (1,4). It is the same triangle moved one unit to the right. Its area remains 8, making its area ratio exactly 100%. Yet part of it now sits outside the reference, and part of the reference lies to its left. Moving the shape has preserved its size without preserving its coverage.
The shared triangle has corners (1,0), (4,0) and (1,3). Its base and height are 3, so its area is 4.5. Divide 4.5 by the reference area 8: coverage is 56.25%. Candidate A therefore gives a direct, reproducible example of 100% area ratio with substantially less than 100% reference coverage.
Take R={(x,y):x≥0,y≥0,x+y≤4}. Its vertices are (0,0),(4,0),(0,4), and A(R)=4×4/2=8. These abstract axes are not CIE xy axes: the large coordinate values have no intended interpretation as chromaticities.
Translate R by (1,0) to obtain G_A, with vertices (1,0),(5,0),(1,4). Equivalently G_A has x≥1,y≥0,x+y≤5. Translation preserves area, hence A(G_A)=8 and r_A=1. Intersecting the inequalities with R removes the weaker x+y≤5 bound and gives x≥1,y≥0,x+y≤4.
Consequently the overlap vertices are (1,0),(4,0),(1,3), with area 9/2. Coverage is c_A=(9/2)/8=9/16=0.5625. The part of G_A outside R and the part of R outside G_A both have area 7/2, but they occupy different regions. Equal total area merely balances those amounts; it does not make either missing region disappear. This calculation supplies the counterexample without assuming any behaviour of a real display.
Adding area does not necessarily fill the gap
Now enlarge the shifted shape. Candidate B has corners (1,0), (6,0) and (1,5). Its base and height are 5, giving area 12.5. Its area ratio is 156.25%, larger than Candidate A’s 100%. However, its left edge is still at 1. It has grown farther above and to the right, rather than filling the reference region to its left.
Inside the reference, the shared triangle is unchanged: its corners remain (1,0), (4,0) and (1,3). Coverage therefore stays 56.25%. The extra candidate area has increased the advertised-size calculation without adding any reference area to the overlap. A larger figure is not automatically evidence of improvement in the particular region being asked about.
Compare Candidate C, with corners (0,0), (5,0) and (0,5). It also has area 12.5 and area ratio 156.25%. This time it contains the entire reference triangle, so coverage is 100%. Candidates B and C have the same area ratio but different coverage. Their placement, not their total size, explains the difference.
Define G_B by x≥1,y≥0,x+y≤6, with vertices (1,0),(6,0),(1,5). Its area is 25/2. Intersecting with R still gives x≥1,y≥0,x+y≤4, exactly the same overlap as G_A. Therefore r_B=25/16 and c_B=9/16.
Define G_C by x≥0,y≥0,x+y≤5. It has vertices (0,0),(5,0),(0,5), so A(G_C)=25/2 as well. Every point in R satisfies its inequalities, giving R⊆G_C and c_C=1. Thus r_B=r_C=1.5625 while c_B≠c_C. The equality of candidate areas cannot distinguish these two containment outcomes.
These comparisons answer two separate questions. Moving from A to B shows that a larger candidate can leave reference coverage unchanged. Comparing B with C shows that equal candidate-to-reference area ratios can hide different coverage. Neither is a claim that wider hardware gamuts lack value; each demonstrates why a total-area statistic cannot, by itself, establish overlap with a particular reference.
A fixed-size shape can lose coverage continuously
We can also move the original reference triangle gradually to the right without changing its size. At a shift of zero, it covers itself completely. At a shift of one unit, we have Candidate A and 56.25% coverage. At two units, the shared triangle has base and height 2, giving area 2 and coverage 25%.
At three units, the shared triangle has area 0.5, so coverage is 6.25%. At four units, the two shapes touch at a boundary point and share no area: coverage is 0%. Throughout all five positions, the candidate triangle has the same area as the reference. The area ratio remains 100% while the coverage moves from 100% to 0%.
This also shows why an overlap percentage has its own limits. It reports how much reference area is shared, not which part is missing. Two missing regions can have equal area but occur in different places. A chart or an explicit boundary description adds information that a single percentage cannot preserve.
For a rightward translation h with 0≤h≤4, write G_h=R+(h,0). The intersection is x≥h,y≥0,x+y≤4. Its legs both have length 4−h, so A(G_h∩R)=(4−h)²/2 and c(h)=(4−h)²/16. Meanwhile r(h)=1 because every candidate is a translation of R.
At h=0,1,2,3,4, the coverage fractions are 1,9/16,1/4,1/16,0. The squared dependence comes from shrinking both legs, not from a nonlinear change in candidate area. The endpoint h=4 leaves a single contact point with zero planar area. These conclusions concern an area measure; contact at a boundary is not positive-area overlap.
The exact calculation also illustrates what c discards. It integrates the intersection into one scalar, losing spatial information about uncovered regions. Equal coverage fractions need not imply the same error location or consequences for a particular image. The original check used exact rational clipping at 17 quarter-unit shifts and reproduced this closed expression; it was a geometry check, not a display or perceptual experiment.
Now use the published encoding coordinates
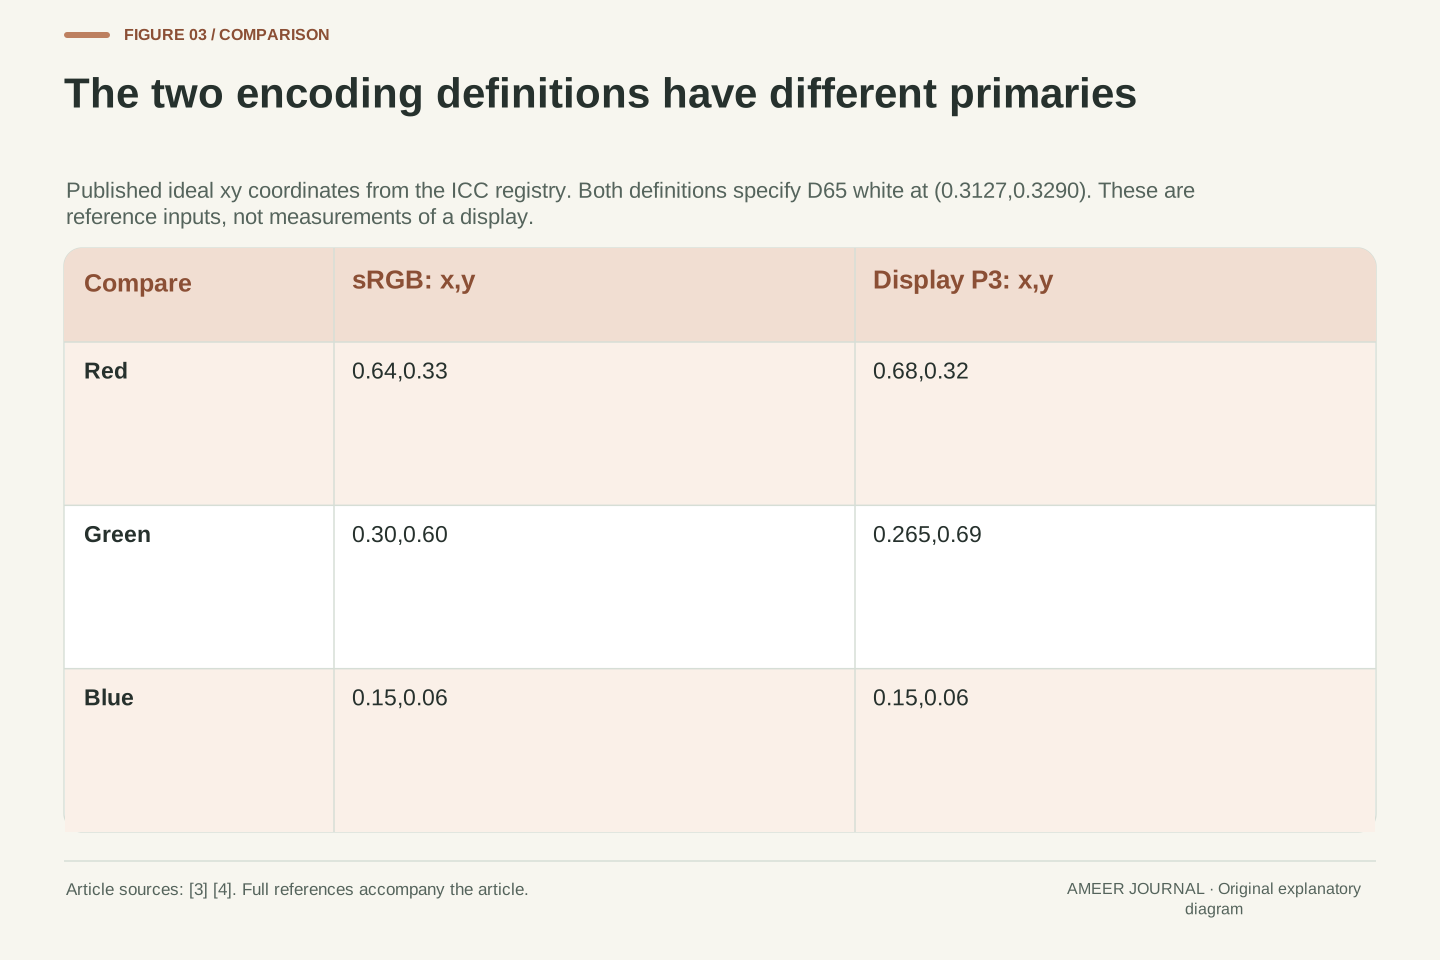
For the next calculation, leave the invented triangles behind. The ICC registry gives sRGB primary coordinates as red (0.64,0.33), green (0.30,0.60) and blue (0.15,0.06). Its Display P3 entry gives red (0.68,0.32), green (0.265,0.69) and the same blue (0.15,0.06) [3][4]. These pairs use x and y chromaticity coordinates.
The two definitions also specify the same D65 white chromaticity, x=0.3127 and y=0.3290 [3][4]. That does not make their primary triangles identical: the red and green corners differ. For the area calculation, we join each encoding’s three primary points. We are calculating from the definitions, rather than measuring how closely a particular screen reaches them.
The Display P3 entry identifies its primary documentation as information supplied by Apple, Version 1.0 dated 9 February 2022 [4]. Naming the exact encoding matters. A short label containing only P3 should not silently replace the full definition used in a calculation. Here every coordinate and percentage refers specifically to the registry’s Display P3 entry.
Use the ICC registry’s sRGB vertices R_s=(0.64,0.33), G_s=(0.30,0.60), B_s=(0.15,0.06) and Display P3 vertices R_p=(0.68,0.32), G_p=(0.265,0.69), B_p=(0.15,0.06) [3][4]. These are xy primary coordinates from two explicitly named encoding definitions.
Both entries specify D65 white chromaticity (0.3127,0.3290) [3][4]. The shared white does not determine the primary triangle: different primary locations can surround the same white. Conversely, knowing a triangle does not specify every part of an encoding. We use the primary locations for this bounded planar-area calculation without treating the area as a complete description of transfer behaviour, numeric representation or device output.
The Display P3 registry entry is Apple-provided primary documentation, Version 1.0 dated 2022-02-09 [4]. We retain that identity and the exact tabulated decimals as calculation inputs. No measured primary coordinates, chromatic adaptation or profile conversion is substituted. This separates the ideal-encoding comparison from the earlier abstract translation examples and from any claim about the coverage of an actual product.
Calculate the two triangles in xy
The sRGB triangle’s area in the xy chart is 0.11205. The Display P3 triangle’s area is 0.152. These are coordinate-area values, not square centimetres on a display. Dividing 0.152 by 0.11205 and multiplying by 100 gives about 135.65%. The inputs are the published primary coordinates; the arithmetic is our calculation [3][4].
We can check the area without estimating it from a coloured picture. For each triangle, multiply each corner’s x value by the next corner’s y value and add those three products. Subtract the corresponding products in the opposite direction, take the positive magnitude, then divide by two. This uses the boundary coordinates directly, so a screenshot’s shape or scale cannot change the result.
In this particular ideal comparison, all three sRGB corners lie inside or on the Display P3 triangle. The whole sRGB triangle is therefore contained in it, and its coverage is 100%. That containment result is an additional geometric check. It does not follow merely from the 135.65% area ratio, as Candidates B and C already showed.
For an ordered triangle with vertices (x_i,y_i), its area is one half the absolute value of Σ(x_i y_(i+1)−x_(i+1)y_i), closing the index cycle. Applying this shoelace expression to the source coordinates gives A_s=2241/20000=0.11205 and A_p=19/125=0.152 [3][4].
The calculated percentage is 100A_p/A_s=304000/2241≈135.653726%. This is the ideal Display P3 primary-triangle area relative to the ideal sRGB primary triangle in xy. The word relative identifies the denominator; it does not turn the number into a percentage of all visible colours, a count of digital code values or a panel measurement.
For containment, evaluate each sRGB vertex against all three consistently oriented Display P3 edge half-planes. Every test is nonnegative. Convexity then places the entire sRGB triangle inside the Display P3 triangle, so their intersection has area A_s and ideal sRGB coverage is 100%. We calculate this separately from the area ratio. Replacing that geometric check with the condition A_p≥A_s would be invalid in general.
The same primaries give another area ratio in u′v′
CIE also defines the 1976 uniform chromaticity scale diagram using coordinates called u prime and v prime. Starting from x and y, calculate a common denominator: minus 2 times x, plus 12 times y, plus 3. Divide 4 times x by it to get u prime, and 9 times y by it to get v prime [5].
For example, the sRGB green point (0.30,0.60) becomes (0.125,0.5625). Nothing about that specified primary changed; we described it in another chart. Transforming all six listed primary positions and calculating the triangles again gives areas of about 0.064891818 for sRGB and 0.081480224 for Display P3.
The resulting area ratio is about 125.56%, rather than 135.65%. Both results come from the same encoding definitions, with different chart coordinates. The ideal Display P3 triangle still contains the ideal sRGB triangle, so coverage remains 100% in this example. An area percentage without its chart therefore leaves out information needed to reproduce or compare the calculation.
The CIE 1976 coordinate definition is u′=4x/D and v′=9y/D, where D=−2x+12y+3 [5]. It equivalently defines these coordinates from tristimulus values. We use the xy form on the same registry primaries, retaining exact rational values throughout the calculation.
As a simple check, sRGB green has D=9.6, giving u′=1.2/9.6=1/8 and v′=5.4/9.6=9/16. After transforming every primary, the triangle areas become A′_s=11205/172672≈0.064891818 and A′_p=480/5891≈0.081480224. Thus 100A′_p/A′_s=552550400/4400577≈125.563170%.
The denominator D stays positive throughout these triangles. The fractional linear mapping preserves their straight-edge representation, and a fresh edge-half-plane check again places every transformed sRGB vertex inside the transformed Display P3 triangle. The intersection area equals A′_s, giving 100% coverage. This result describes the specified ideal triangles in the specified chart. It is not a correction factor that can convert every manufacturer’s unnamed gamut percentage into another reporting convention.
The coordinate change stretches area unevenly
Why does the area ratio change if we transform both triangles? It would stay the same if the new chart multiplied every small area by the same constant. This transformation does not do that. Its denominator changes with the point’s position, so different parts of the chart receive different amounts of area stretching [5].
The two primary triangles include different regions. When those regions are weighted differently by the new chart, their total areas can change by different proportions. Dividing one new area by the other therefore need not reproduce the old ratio. This explains the 135.65% and 125.56% results without suggesting that one encoding acquired or lost a primary colour.
Containment is a different property. In our ideal example, every point of the smaller triangle stays within the transformed larger triangle, so full coverage survives. A partially overlapping pair can also have its coverage percentage change when the area measure changes. The safe comparison is to name the chart and apply the same method to the reference, candidate and overlap.
For the transformation in [5], direct differentiation gives ∂u′/∂x=4(12y+3)/D², ∂u′/∂y=−48x/D², ∂v′/∂x=18y/D² and ∂v′/∂y=9(3−2x)/D². The determinant simplifies to 108/D³. This local area multiplier is position-dependent, so the map is not a constant-area scaling.
Consequently an area integral over G and an area integral over R need not receive the same proportional change. Their ratio can differ between charts. An intersection that occupies only part of R can likewise receive a different relative weighting. The derivation explains why stating an area or overlap percentage requires a coordinate measure, even when the underlying regions refer to the same stimuli.
Exact inclusion remains a set relation under the same one-to-one transformation. For the ideal triangles used here, R⊆G before and after mapping, so the intersection is the whole reference in each chart. This is why coverage stays 100% while the area ratio changes. The derivation does not establish either chart’s area as a universally perceptually uniform measure or a count of distinguishable colours.
A chromaticity chart leaves out overall scale
There is another limit to what these charts describe. CIE defines chromaticity coordinates by dividing each of three tristimulus values by their sum. The three resulting coordinates add to 1, so two are enough to identify the chromaticity [6]. The normalization keeps the proportions while removing their common scale.
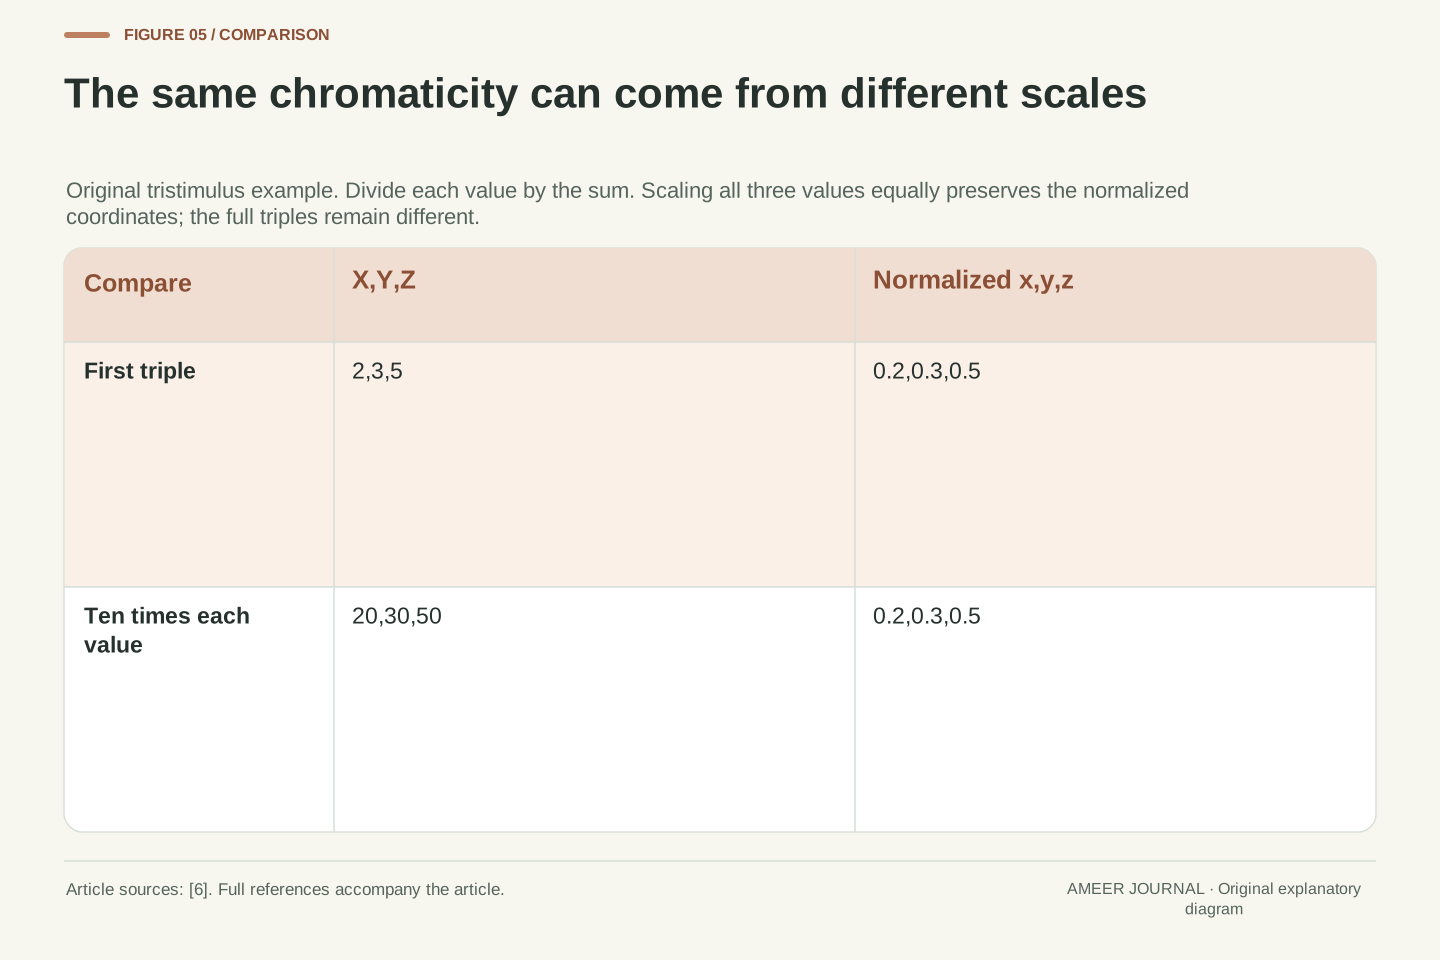
Take invented tristimulus values of 2,3 and 5. Their sum is 10, giving x=0.2 and y=0.3. Now multiply all three values by 10, making 20,30 and 50. Their sum becomes 100, but the coordinates remain x=0.2 and y=0.3. These two different triples land at the same point on the chart.
This example explains why a two-dimensional primary triangle cannot describe every aspect of a display’s colour output. Its area calculation does not contain the removed scale information. It also has no input describing the number of encoded steps between values. A larger triangle therefore does not, by this calculation alone, establish brightness range, bit depth or the number of distinct output colours a device actually produces.
For a nonzero tristimulus sum S=X+Y+Z, the normalized coordinates are x=X/S, y=Y/S and z=Z/S. Their sum is 1, leaving two independent chromaticity coordinates, consistent with the CIE definition [6]. For a positive scalar k, normalization of (kX,kY,kZ) gives the same (x,y,z).
Our example uses (X,Y,Z)=(2,3,5) and (20,30,50). Both yield (x,y,z)=(0.2,0.3,0.5), although the underlying triples differ by a factor of 10. This is a direct consequence of the coordinate definition, not a claim that two such physical stimuli have identical full colour appearance under all viewing conditions.
The primary-triangle calculations therefore omit the common tristimulus scale and do not specify a luminance-dependent three-dimensional boundary. They also take no quantization or code-count input. Inferring bit depth, an output-colour count or a full colour volume from these areas would introduce information absent from the model. The scope limitation follows from the quantities used, without requiring a particular display technology or a purported universal conversion from area to perceived colour capacity.
An attainable range does not verify correct output
Coverage asks which reference region is included in the candidate range. Accuracy asks whether a requested colour is actually produced as intended. Those questions can come apart. EIZO’s explanation explicitly separates wide gamut from the ability to generate accurate colour [1]. Our area and overlap calculations do not measure an output error.
Consider an invented system that can produce a particular set of colours. Now imagine that its red and green input controls are exchanged. If both controls still cover their original full ranges, exchanging their names does not remove any output from the system’s attainable set. Yet a request meant to select the red primary now selects the green one.
The gamut boundary and its area can therefore stay unchanged while the request-to-output mapping becomes wrong. This is a logical example, not a report of a faulty product. It shows why even full reference coverage cannot replace an accuracy check using specified requests and measured outputs. A percentage describing the range is useful, but it does not contain that mapping evidence.
Reachability and mapping accuracy are different properties. A gamut boundary describes an attainable set; an accuracy assessment needs expected and actual outputs for specified inputs. EIZO distinguishes gamut width from accurate colour generation [1]. The two planar statistics computed here contain no pointwise error measurements.
To demonstrate the distinction, let f map an RGB input cube onto an attainable output set G. Let P exchange the red and green input coordinates. Because P is a bijection of the cube, the range of f∘P is still G. However, for distinct red and green primary outputs, the output assigned to an input requesting one primary is changed by that permutation.
Thus equal gamut sets, and hence equal area and coverage statistics, can coexist with different request-to-output mappings. This original set argument does not model a real calibration fault or supply a colour-difference threshold. It establishes only that boundary coverage cannot logically certify pointwise accuracy. A suitable output-error assessment would add evidence absent from r and c, rather than extracting it from either percentage.
Keep the reference, chart and measure with the number
A useful gamut statement says what was compared and how. For our calculated 135.65%, the candidate is the ideal Display P3 primary triangle, the reference is the ideal sRGB primary triangle, the chart is xy and the measure is total-area ratio. For 125.56%, only the chart changes to CIE 1976 u prime and v prime. Both percentages are calculated from definitions, not measured from a screen [3][4][5].
For an actual device report, keep the device’s measured boundary and the conditions attached to the claim. A display mode, a measurement method and a named reference help explain what the number describes. If the report supplies only a percentage, missing information cannot be recovered by assuming the interpretation most favourable to the product.
When the question is reference coverage, ask for the overlap result in a stated chart. When it is accurate reproduction, look for evidence comparing requested and produced colours. Our examples leave a concrete boundary: 156.25% total area can accompany 56.25% or 100% coverage, and neither of those coverage figures establishes the accuracy of the output mapping.
A reproducible record identifies candidate and reference boundaries, the coordinate system, the area measure and whether the numerator is A(G) or A(G∩R). For ideal-encoding calculations, preserve the source coordinates and definition version. For a device claim, distinguish those reference inputs from the measured device boundary and retain the reported mode and measurement conditions.
Our 135.653726% result means 100A(Display P3)/A(sRGB) for the registry primary triangles in xy. The 125.563170% result means the same ratio after their CIE 1976 u′v′ transformation [3][4][5]. The 100% coverage results come from separate intersection checks. None is presented as a product measurement, nor as a conversion rule for an unspecified commercial statistic.
The abstract B/C pair supplies the complementary limitation: identical 156.25% area ratios permit 56.25% and 100% coverage. Adding a request-to-output permutation supplies another: identical attainable sets permit different colour mappings. Keeping these quantities separate allows the reader to interpret a reported gamut percentage without assigning it information about containment, scale or accuracy that the chosen calculation never supplied.
Sources & further reading
Explore the references behind this guide. External pages may change after our review.
- Understanding the Color Gamut of an LCD MonitorEIZO · Accessed 7 Nov 2026
- What Does a >100% Rec.709 / DCI-P3 Color Gamut Mean? | BenQ USBenQ · Accessed 7 Nov 2026
- sRGB | Three Component Color Encoding RegistryInternational Color Consortium · Accessed 7 Nov 2026
- Display P3 — RGB colour space registryInternational Color Consortium / Apple primary documentation · Accessed 7 Nov 2026
- 17-23-073 | CIEInternational Commission on Illumination (CIE) · Accessed 7 Nov 2026
- 17-23-053 | CIEInternational Commission on Illumination (CIE) · Accessed 7 Nov 2026
Article updated 7 Nov 2026.
Found something we should revisit?
Good explanations get better with thoughtful feedback.