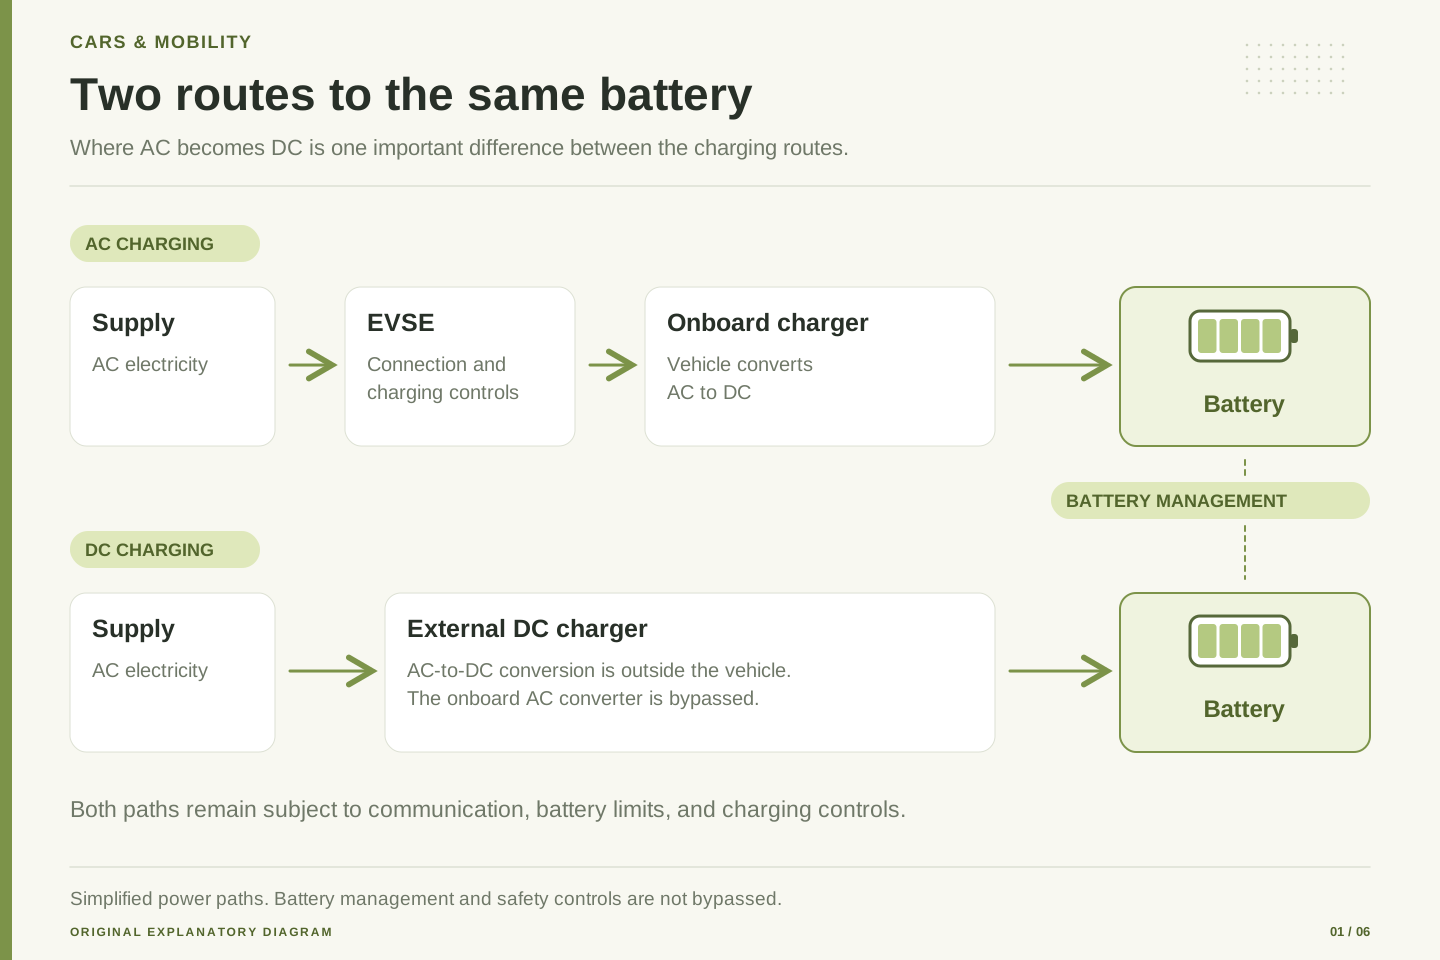
What you’ll take away
- Cold-weather energy use combines traction, time-based cabin heating and battery thermal effects, so miles alone cannot predict consumption.[1]
- AAA's controlled study of three EVs and three hybrids found larger cold-weather penalties for EVs than for hybrids, but the result is conditional on its sample and test conditions.[1]
- A hypothetical heater calculation shows heating energy grows with time: at an assumed constant 3 kW, 2 hours uses 6 kWh, separate from traction energy.
- EPA label values use dynamometer cycles and a general 0.7 adjustment for comparison, not as a forecast for an individual trip.[4]
- A robust plan separates distance-based and time-based loads, tests sensitivity to duration and set point, and leaves a margin for uncertainty.[1]
The question is energy, not just distance
A cold-weather trip asks two different questions. How far will the car travel, and how much stored energy will it use to travel that distance while also heating the cabin and operating in cold conditions? Range describes distance, while efficiency describes how much energy is needed for each mile. When either changes, the trip changes. A driver who plans only by miles may therefore be surprised, even if the car itself is working normally.[1][4]
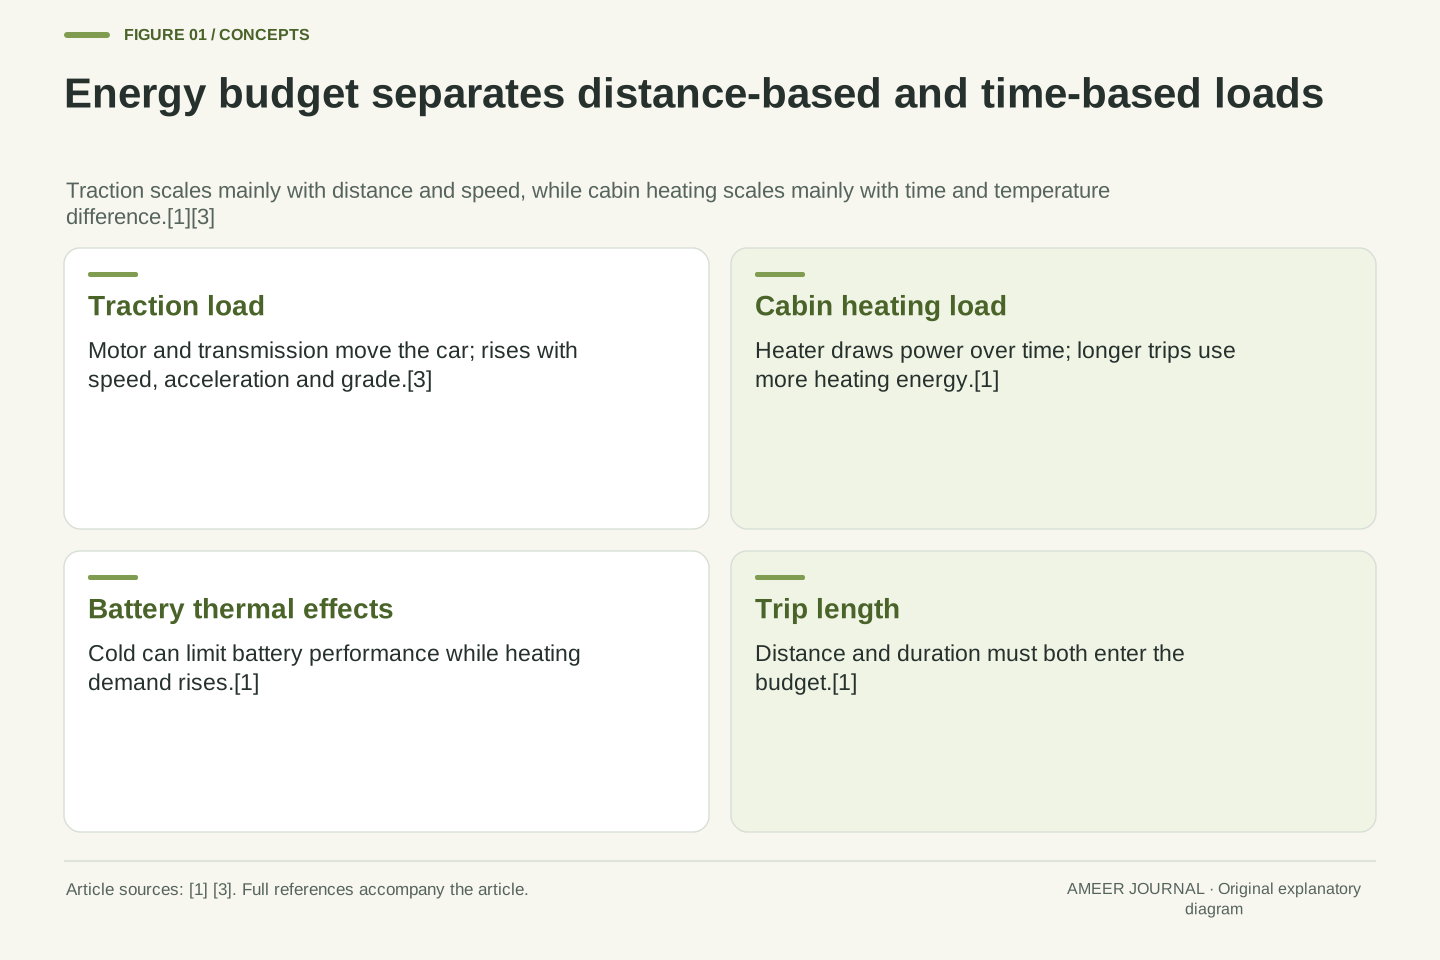
The useful way to think about the trip is as a budget. The battery starts with a limited amount of usable energy. Traction uses part of it to move the car. Cabin heating uses another part for as long as heat is needed. Cold conditions can affect both the battery and the vehicle systems that manage temperature. Trip length matters because some loads grow with distance, while others grow with time. A short trip and a long trip can therefore have different energy patterns even at the same temperature.[1][3]
Range and efficiency are related but distinct quantities. Range is a distance outcome under specified conditions, whereas efficiency expresses energy consumption per unit distance, commonly in miles per gallon of gasoline equivalent for plug-in vehicles. A reduction in efficiency can reduce range, but the size of the range effect also depends on usable battery energy, the test cycle, and the loads present during operation. Treating a percentage change in one quantity as an identical percentage change in the other is therefore an approximation, not a physical identity.[1][4]
An energy budget separates loads by their governing variable. Traction energy is primarily distance- and speed-dependent, cabin heating is primarily time- and temperature-difference-dependent, and battery thermal management can involve both operating time and the thermal state of the pack. This separation explains why two trips with equal distance can consume different energy: the slower trip may spend more time heating the cabin, while the faster trip may spend more energy on traction. The budget must therefore track both miles and minutes.[1][3]
Traction: the energy needed to move the car
Traction is the energy used by the electric motor to turn the wheels through the transmission. In an all-electric vehicle, the traction battery pack stores electricity for the motor, and power electronics control how that energy flows and how much torque the motor produces.[3] This is the core driving load. It rises when the car accelerates, climbs, travels at higher speed, or pushes against greater resistance. It falls when the car slows or recovers energy during braking in vehicles designed to do so.[3]
Traction does not disappear in cold weather, but it is rarely the only change. Cold air, road conditions, tire pressure, speed and driving style can all alter the energy needed to cover a mile. The AAA study kept its laboratory conditions controlled so temperature effects could be compared, but real roads add variation that a laboratory test cannot reproduce exactly.[1] That is why a traction estimate from a mild-weather trip should be treated as a starting point, not a guarantee for a winter trip.[1][4]
The traction path in a battery electric vehicle runs from the traction battery pack through the power electronics controller to the electric traction motor and then through the electric transmission to the wheels.[3] The controller regulates energy flow, motor speed and torque, so traction demand is a controlled electromechanical load rather than a fixed draw. Aerodynamic drag increases strongly with speed, rolling resistance depends on tire and surface conditions, and grade changes the potential-energy component. Regenerative braking can return part of the kinetic energy in some vehicles, but the recovered fraction depends on motor, electronics and battery acceptance limits.[3]
Cold weather can interact with traction indirectly through vehicle thermal management and through changes in operating conditions. The AAA dynamometer study isolated temperature by testing vehicles at 20°F, 75°F and 95°F with HVAC set at 72°F, which supports comparison across temperatures but does not reproduce wind, snow, grades or individual driving behaviour.[1] Consequently, a laboratory traction result should be interpreted as a controlled comparison, while a real trip adds uncontrolled variables that can move consumption in either direction.[1][4]
Cabin heat: a time-based load that changes the budget
Cabin heating is different from traction because it is mainly a time-based load. The heater may draw power continuously while the car is being driven, whether the car is moving quickly or slowly. That means a long, slow trip can use a large amount of energy for heat even if the distance is modest. A shorter trip at the same temperature may use less heating energy simply because it ends sooner.[1]
This time-based behaviour is one reason cold weather affects electric vehicles strongly. AAA reported that cold operation increased energy demand and reduced range, and it linked the effect to battery performance limitations and the need for cabin heating.[1] Targeted comfort features such as seat and steering-wheel heat can reduce the need to heat the whole cabin as aggressively, which is why AAA listed them among real-world efficiency strategies.[1] The key point is to ask not only how far the trip is, but how long the cabin will need heat.[1]
Cabin heating load is governed by the heat loss from the cabin and the temperature difference between the interior set point and ambient conditions, integrated over time. Unlike traction, which scales primarily with distance and speed, heating energy scales with duration for a given thermal load. A vehicle travelling slowly for two hours can therefore accumulate more heating energy than the same vehicle travelling the same distance quickly in one hour, even if traction energy were identical. This distinction is central to cold-weather budgeting because it decouples part of the energy use from distance.[1]
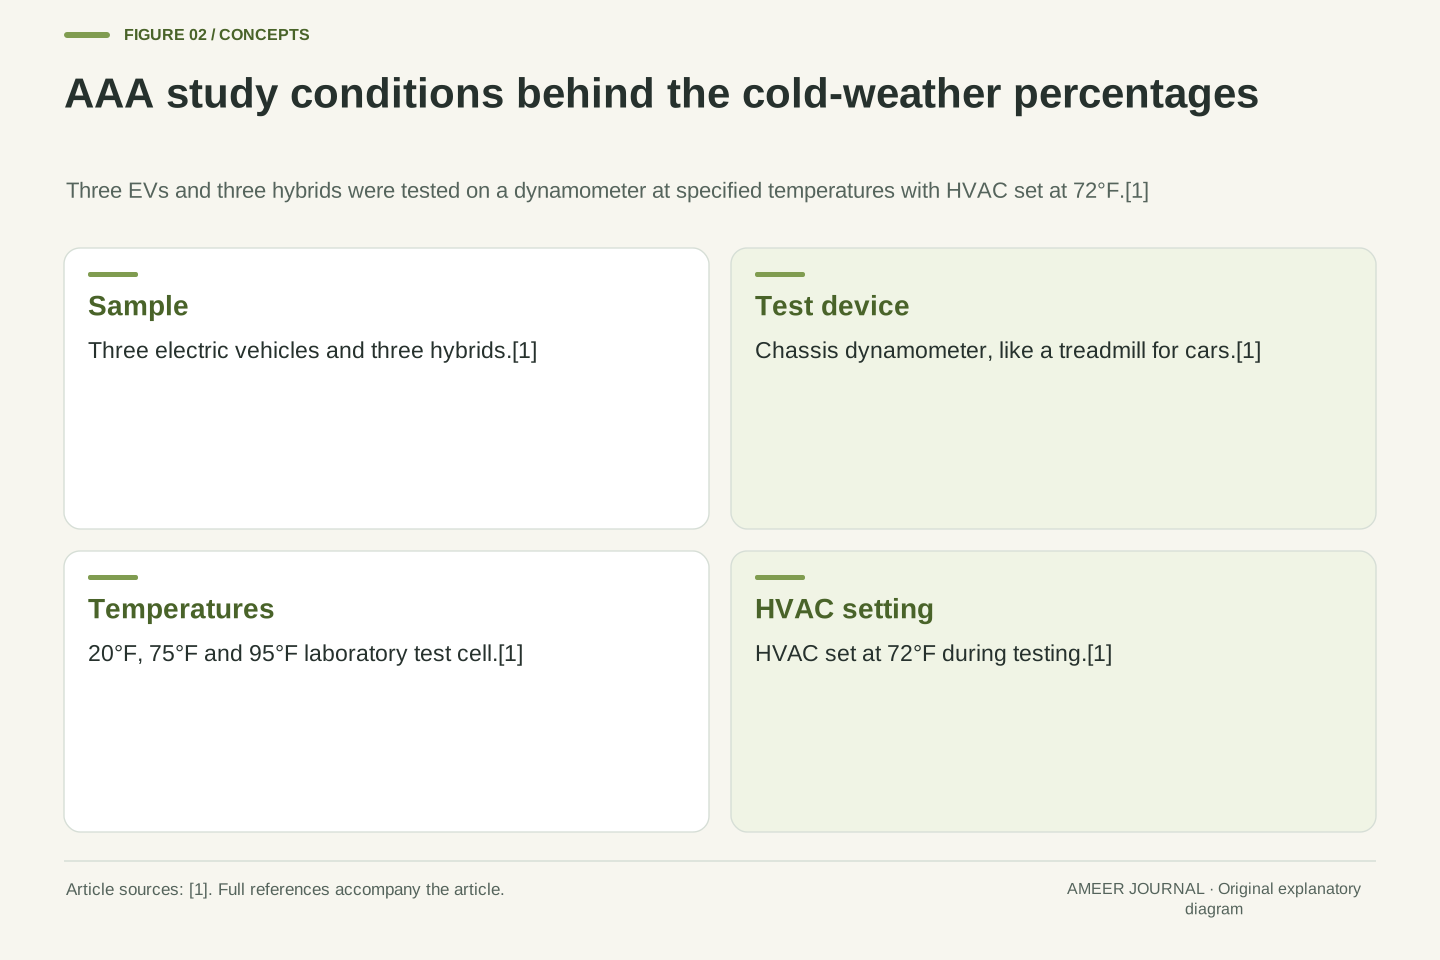
The AAA study set HVAC at 72°F during testing at 20°F, 75°F and 95°F, creating a controlled thermal demand that allowed temperature effects to be compared across vehicles.[1] In real use, set point, occupancy, solar gain, defrost use and targeted heating features alter the load. AAA recommended preconditioning the cabin while plugged in and using seat and steering-wheel heat as targeted comfort features, which reduce the portion of heating energy drawn from the traction battery during the trip.[1] These strategies change when and where the energy is drawn, not the underlying heat-loss physics.[1]
Battery and cold conditions: storage is not the whole story
The traction battery pack stores the electricity that powers the motor and supports vehicle systems. Most of today's all-electric vehicles use lithium-ion batteries, although the exact chemistry varies.[2] A battery is not simply a fuel tank with a fixed amount that can always be delivered at the same rate. Temperature, charge level, age and the demands placed on the pack can affect how readily it delivers energy. Cold weather is therefore both a storage issue and a vehicle-systems issue.[1][2]
AAA attributed the larger cold-weather effect for electric vehicles to battery performance limitations together with cabin heating needs.[1] That combined explanation matters. If only the battery were affected, the problem would be mainly about available energy. If only heating were affected, the problem would be mainly about an extra load. In practice, both can operate at once: the car may need more energy for heat while the battery delivers energy less readily in the cold.[1] A good budget keeps those two effects separate so the driver can see which one is driving the result.[1]
Most all-electric vehicles and plug-in hybrids use lithium-ion batteries, valued for high energy per unit mass and volume, high power-to-weight ratio, high energy efficiency and low self-discharge, although exact chemistry varies by application.[2] These properties describe the storage technology in general terms; they do not establish the performance of any particular pack at a given temperature. Battery behaviour in cold conditions depends on pack design, thermal management, state of charge and the power demanded by traction and auxiliary loads. The AAA finding that electric vehicles were more affected in cold weather than hybrids is consistent with a combined mechanism involving battery performance limitations and cabin heating demand.[1]
The thermal system in an electric vehicle maintains a proper operating temperature range for the motor, power electronics and other components.[3] In cold weather, thermal management may therefore compete for energy with traction and cabin heating, or it may protect later performance by keeping components within their intended range. The net effect cannot be inferred from chemistry alone. It requires vehicle-specific thermal design and control strategy, which is why AAA noted that effects vary by vehicle and its control strategies in hot weather and, by the same logic, should not be assumed identical across models in cold weather.[1][3]
How tests create numbers: dynamometers, cycles and adjustments
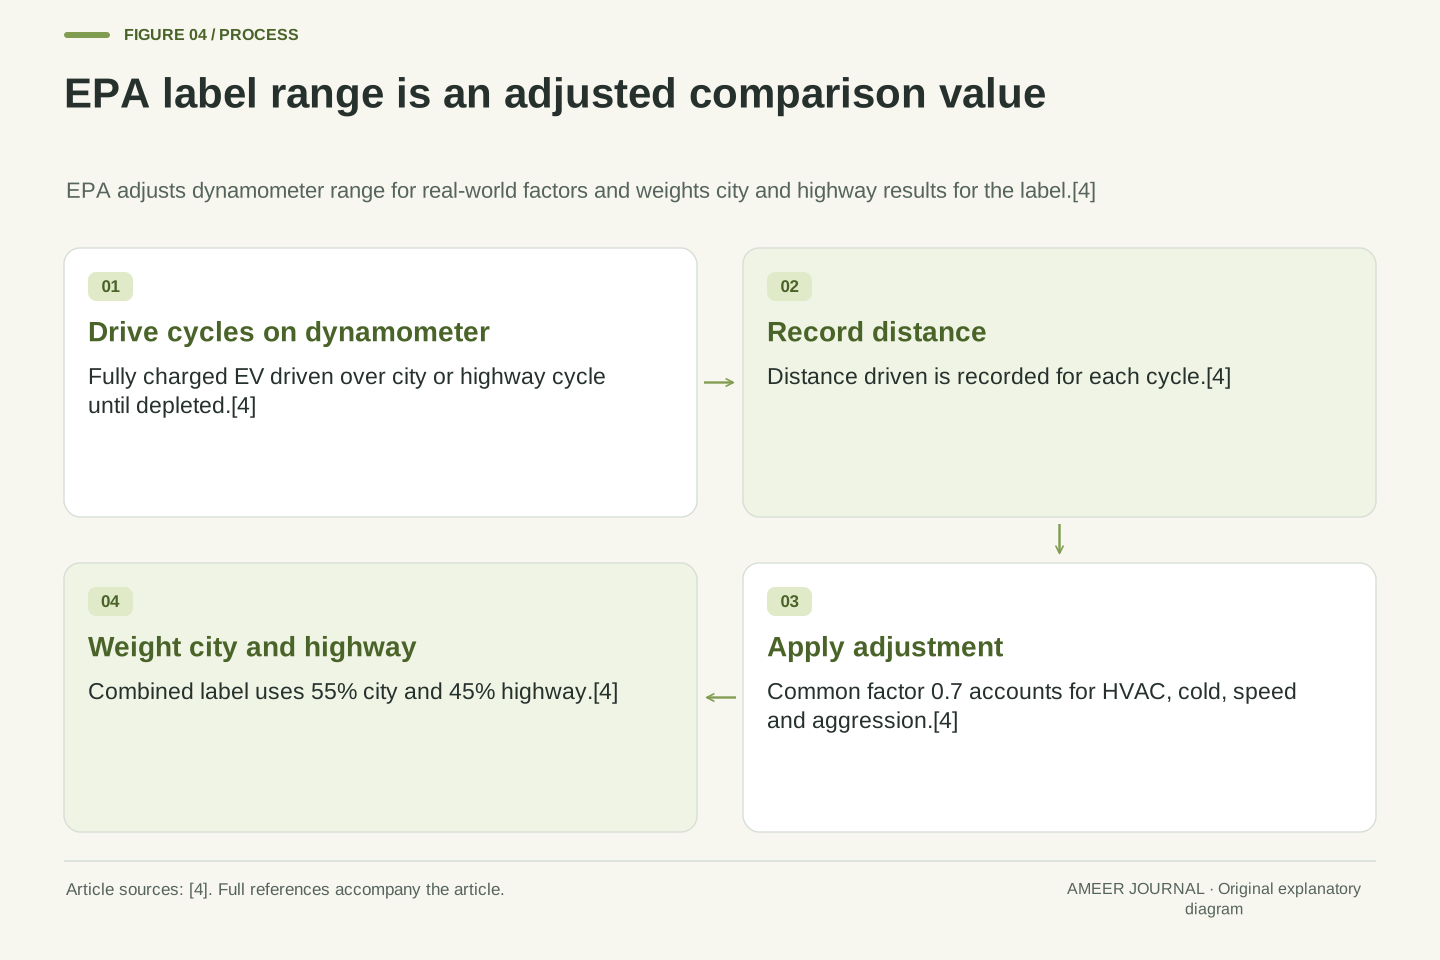
Laboratory tests exist to make vehicles comparable. EPA describes testing on a dynamometer, which works like a treadmill for cars, with the vehicle following defined driving schedules that simulate typical trips.[4] For electric vehicles, a fully charged vehicle is driven over a city or highway cycle until the battery is depleted, and the distance driven is recorded.[4] This controlled approach is useful because every vehicle faces the same schedule, but it is not the same as an individual driver's trip.[4]
EPA also adjusts laboratory range to account for real-world factors not represented in the test, including air conditioning, cold temperatures, high speed and aggressive driving.[4] The most common adjustment described by EPA is a factor of 0.7 applied to test parameters including range.[4] That adjustment is a general method for producing a label value. It is not a promise that a particular driver, route and temperature will produce exactly 70 percent of the laboratory result. The label is a comparison tool, not a trip forecast.[4]
EPA range testing for electric vehicles uses dynamometer cycles in which a fully charged vehicle is driven repeatedly over a city or highway cycle until depletion, with distance recorded.[4] Automakers may use a single-cycle approach or a multi-cycle approach combining city, highway and constant-speed cycles.[4] The resulting city and highway ranges are adjusted for real-world factors not represented in laboratory procedures, including air conditioning, cold temperatures, high speed and aggressive driving, most commonly by a factor of 0.7.[4] Adjusted city and highway values are then weighted, 55 percent and 45 percent respectively, to produce the combined label range.[4]
The EPA fuel-economy test set includes a cold test at 20°F with HVAC set to specific heat and defrost settings, alongside city, high-speed and hot tests.[4] MPGe expresses plug-in vehicle consumption in gasoline-equivalent terms, and EPA states that MPGe values include charging losses because charging is not 100 percent efficient.[4] The measurement boundary therefore extends from the wall outlet to the vehicle, which is useful for cost comparison but means the label value is not a pure measure of energy delivered to the wheels. Laboratory control improves comparability while necessarily omitting route-specific variables.[4]
Why one percentage cannot predict every driver
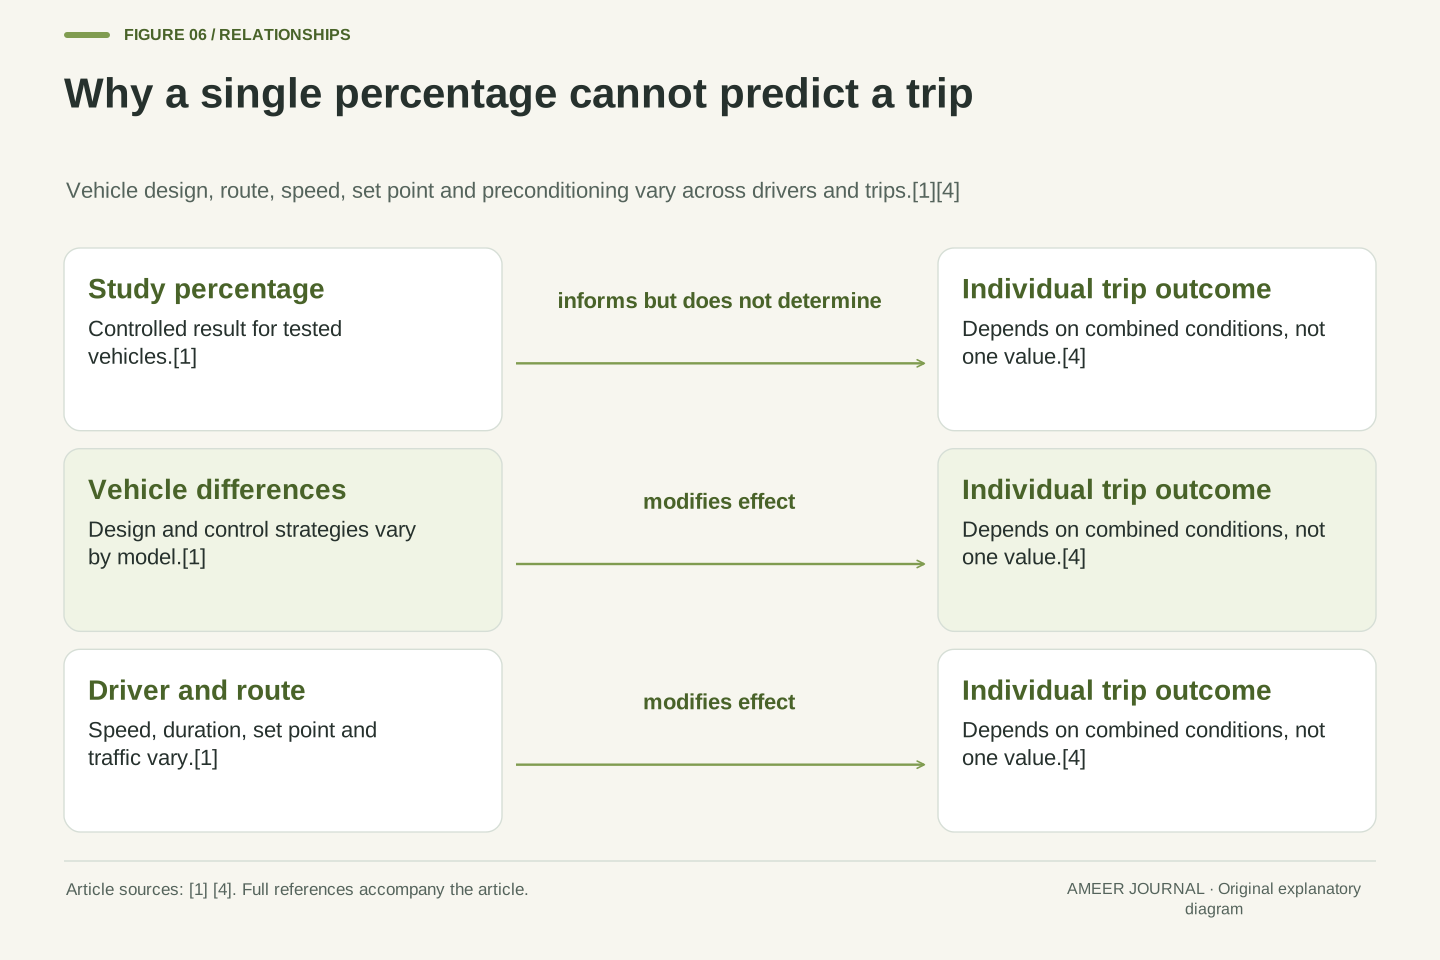
A single percentage can be misleading if it is treated as a universal prediction. AAA reported that, in its study, electric vehicles showed a 10.4 percent reduction in efficiency and an 8.5 percent loss of driving range compared with moderate temperature at 75°F, under its specified test conditions.[1] Those numbers describe the tested vehicles under controlled conditions. They do not mean every electric vehicle, on every route, in every cold-weather trip, will lose exactly that amount.[1]
The reason is variation. Vehicles differ in size, insulation, heating systems, battery design and control strategies. Drivers differ in speed, set point, trip length, traffic and whether they precondition the cabin. AAA itself advised drivers to consider climate, energy costs and driving patterns when choosing a vehicle.[1] A percentage from a controlled study is best used as evidence that cold weather matters and as a starting point for planning, not as a substitute for understanding the specific car and trip.[1]
The AAA study tested three electric vehicles and three hybrids on a chassis dynamometer at 20°F, 75°F and 95°F with HVAC set at 72°F.[1] Its results are therefore conditional on sample, test cycle, thermal set point and laboratory control. Generalising a single percentage to all drivers commits an ecological inference error: it transfers a group-level controlled effect to heterogeneous individual trips without accounting for vehicle design, route, speed, occupancy, preconditioning or ambient variation. The study's own recommendations emphasise climate, energy costs and driving patterns as decision variables, which reinforces that the percentage is an input to planning rather than a deterministic forecast.[1]
Efficiency and range percentages also have different denominators. A reduction in MPGe describes energy per mile, while a reduction in calculated range describes distance achievable from available energy under the test conditions.[1] Because range depends on both efficiency and usable energy, the two percentages need not match. EPA's adjustment method makes the same point structurally: laboratory range is transformed by a general factor and then weighted across cycles to produce a label value, which is explicitly an estimate for comparison rather than a measurement of a future trip.[4]
Worked example: a hypothetical heater-power-by-time calculation
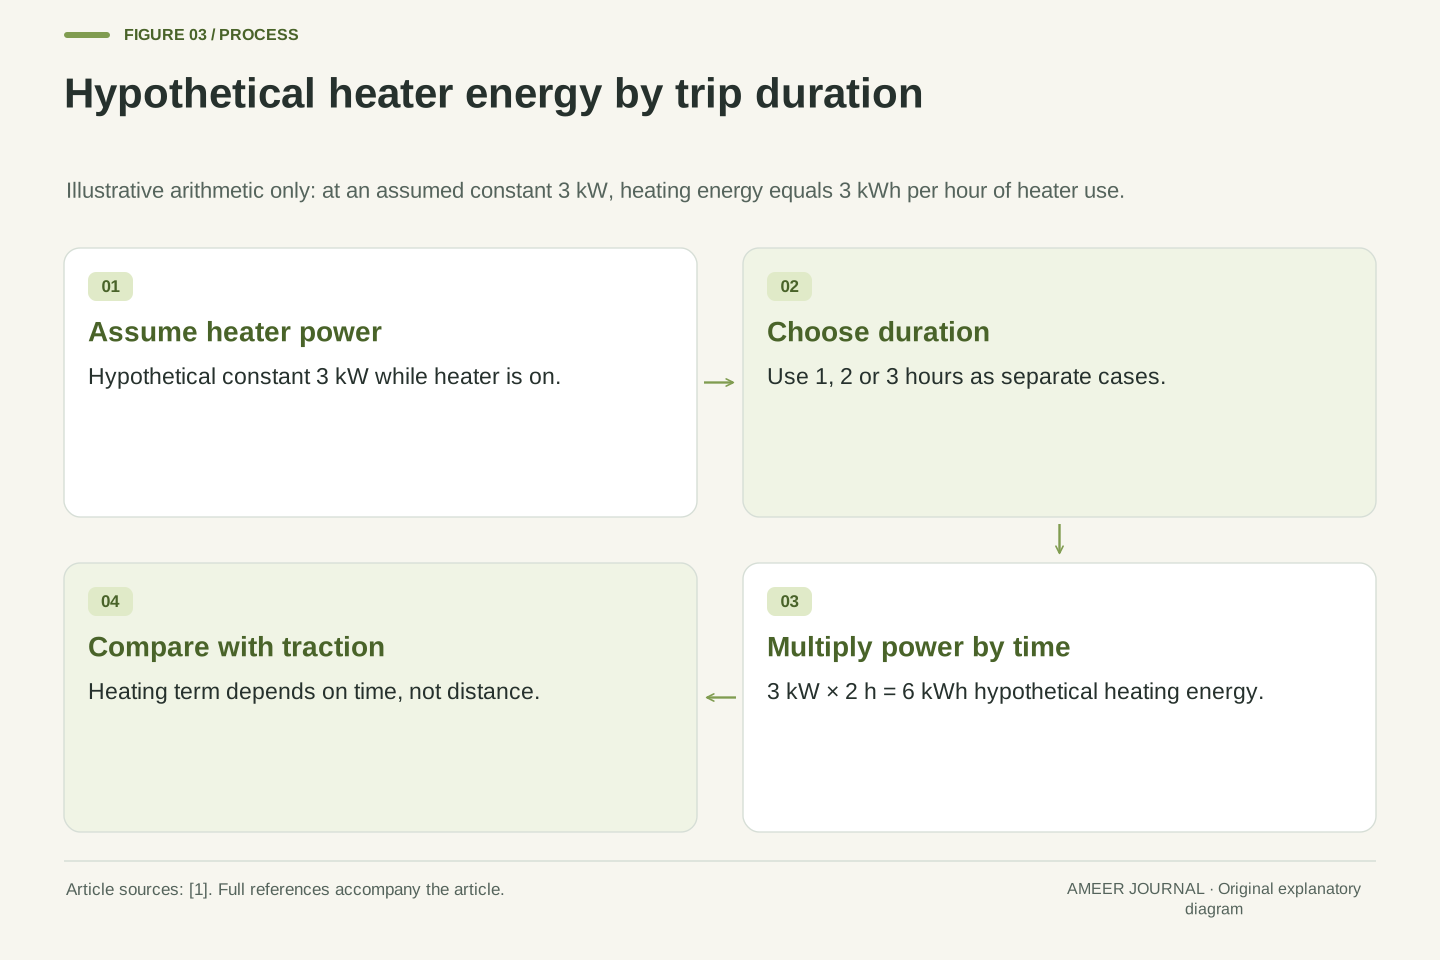
The following example is entirely hypothetical and is used only to show the arithmetic. Assume, for illustration, that a car's cabin heater draws a constant 3 kilowatts while it is on. Assume the trip lasts 2 hours. Energy equals power multiplied by time, so 3 kilowatts times 2 hours equals 6 kilowatt-hours. That 6 kilowatt-hours is the hypothetical heating energy for the trip, separate from any traction energy.[4]
Now change only the time. If the same hypothetical heater runs for 1 hour, it uses 3 kilowatt-hours. If it runs for 3 hours, it uses 9 kilowatt-hours. The distance does not enter this calculation at all. That is the central lesson: heating energy grows with time, while traction energy grows mainly with distance and speed. A driver who knows the trip will take longer in cold weather should therefore expect the heating portion of the budget to grow even if the route is unchanged.[1]
To use this in practice, a driver can make a simple table with three columns: trip time, assumed heater power, and heating energy. The assumed power must be labelled as an assumption, not a measured value for the specific car. The table is still useful because it shows sensitivity. If doubling the time doubles the heating energy, then traffic, detours and slow speeds matter for energy as well as for arrival time. The calculation does not predict the car's actual consumption; it explains why time belongs in the budget.[1]
The worked example uses only the definition of electrical energy as power integrated over time. Under the stated hypothetical assumptions of constant heater power P = 3 kW and duration t = 2 h, heating energy E = P × t = 6 kWh. For t = 1 h, E = 3 kWh; for t = 3 h, E = 9 kWh. These values are arithmetic consequences of the assumptions, not measurements of any vehicle. Real heater power varies with set point, ambient temperature, defrost demand and control strategy, so the constant-power assumption is a simplification that must be labelled as such.[1]
The example also demonstrates why energy budgeting requires both distance-based and time-based terms. A minimal model can be written as total energy equals traction energy per mile multiplied by distance, plus heater power multiplied by time, plus any additional thermal-management energy. The model is useful because it separates variables that respond to different driver choices. Increasing speed raises the traction term but may reduce the time term; lowering the cabin set point reduces the heater term but may affect comfort. The model does not capture battery temperature effects, which is why it should be treated as a framework rather than a prediction.[1][3]
Comparing cold, moderate and hot conditions without overclaiming
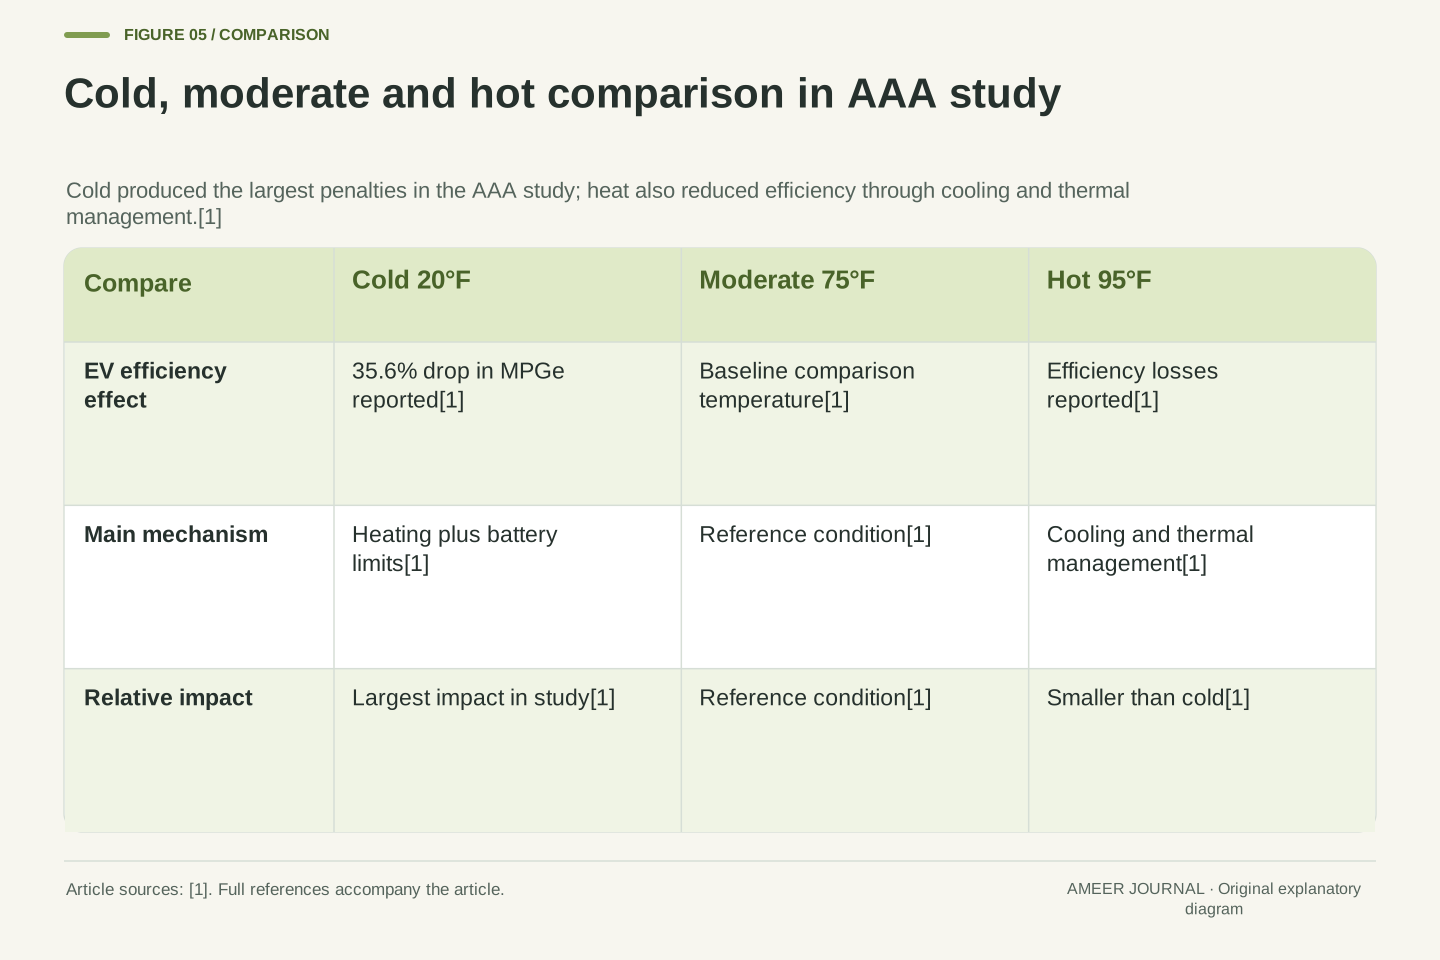
AAA's study compared cold, moderate and hot laboratory temperatures, which makes it possible to see that cold had the largest effect in that study. At 20°F, electric vehicles showed a 35.6 percent drop in MPGe and a 39.0 percent decrease in calculated driving range in the reported findings.[1] At 95°F, the study also found efficiency losses, which AAA attributed to cabin cooling and thermal management, but the effects were generally smaller than in cold weather.[1] The comparison supports a clear conclusion: in that study, cold was the more demanding condition.[1]
The comparison also shows why hybrids and electric vehicles should not be treated as identical. AAA reported a 12.0 percent decrease in hybrid fuel efficiency in its key findings, while electric vehicles showed larger cold-weather penalties in MPGe and range.[1] The mechanisms differ because a hybrid uses an engine and fuel system in addition to electric components, while an all-electric vehicle relies on its traction battery for both traction and cabin heating.[1][3] A fair comparison therefore asks how each powertrain meets the same thermal demand, not whether one percentage can be copied to the other.[1]
The AAA comparison is structured around three laboratory temperatures: 20°F for cold, 75°F for moderate and 95°F for hot, with HVAC set at 72°F.[1] The reported cold-weather results for electric vehicles were a 35.6 percent drop in MPGe and a 39.0 percent decrease in calculated driving range, while hybrids showed a 12.0 percent decrease in fuel efficiency in the key findings.[1] AAA concluded that cold weather had the largest impact, especially for electric vehicles, and that heat also reduced efficiency for both powertrains due to cabin cooling and thermal management, with effects varying by vehicle and control strategy.[1]
The comparison must preserve its qualifiers. The vehicles were three electric vehicles and three hybrids tested on a chassis dynamometer, not a representative sample of all models.[1] Cost findings in the same release depended on electricity and fuel prices as of March 27, 2026, and on whether charging occurred at home or at public chargers, so they should not be converted into current ownership-cost advice.[1] The durable lesson is mechanistic: cold imposes a larger combined load through heating and battery limitations, while heat imposes a smaller load through cooling and thermal management, with magnitude dependent on design and control.[1]
Edge cases: when a simple budget breaks down
A simple budget breaks down when conditions change during the trip. A trip that starts in mild weather and ends in a cold snap will not match a single-temperature estimate. A trip with long idling, heavy defrost use, or frequent stops will also differ from a steady-driving estimate. Short trips can be especially sensitive because the cabin and battery may still be warming up when the trip ends. In those cases, the average energy per mile can look high even though the total energy used is small.[1]
Another edge case is the difference between the start and end of a trip. A car that begins with a preconditioned cabin while plugged in has already used energy from the wall outlet rather than from the battery during the trip.[1] A car that begins cold may use more battery energy early in the trip. The same route can therefore produce different battery consumption depending on what happened before departure. A budget that ignores preconditioning will misattribute the difference to driving efficiency.[1]
The most important edge case is uncertainty itself. A budget is a planning tool, not a measurement. If a driver treats the estimate as exact, a small change in temperature, speed or traffic can create a false sense of precision. The safer approach is to build the budget with ranges: a lower estimate, a central estimate and a higher estimate. That way the plan remains useful even when the real trip differs from the assumptions.[4]
Simple linear budgets fail when loads are non-stationary. Cabin heating demand is highest during warm-up, battery thermal state evolves during operation, and defrost or seat-heating use can be intermittent. Short trips are dominated by transient warm-up energy, so energy per mile is a poor summary statistic because the denominator is small while the numerator includes fixed warm-up costs. Long trips approach a steadier state in which average power and average consumption per mile become more stable. A single average therefore cannot describe both regimes without qualification.[1][3]
Preconditioning introduces a boundary problem. Energy used while plugged in is drawn from the external supply, while energy used after departure is drawn from the traction battery.[1] EPA's MPGe boundary similarly includes charging losses and measures from the wall outlet, which is appropriate for cost accounting but different from a battery-only trip budget.[4] If the boundary is not stated, preconditioning can make a trip appear more efficient than it was in total energy terms, or less efficient if wall energy is counted without noting that it was not drawn from the battery. Explicit boundaries are therefore a methodological requirement, not a presentational detail.[1][4]
A planning checklist that respects the limits of the evidence
A practical checklist starts with the trip itself. Write down the distance, the expected duration, the forecast temperature and the cabin set point. Then separate the budget into traction, heating and any other major loads. Use the hypothetical heater calculation to test sensitivity: what happens if the trip takes an extra hour? What happens if the set point is lower? The goal is not to produce a precise number, but to see which assumption matters most.[1]
Next, check the conditions that change the budget. Confirm tire pressure, consider preconditioning while plugged in, and consider targeted heating such as seat and steering-wheel heat instead of heating the entire cabin to a high set point.[1] AAA also advised avoiding sustained high speeds in extreme temperatures and planning charging to minimise unnecessary fast charging in cold weather.[1] These are planning considerations, not guarantees. Finally, leave a margin for uncertainty. If the budget only works under the most optimistic assumptions, it is not a robust plan.[1]
The checklist should also record what the evidence cannot tell you. The AAA study involved six vehicles under controlled conditions, so it cannot predict a specific car's trip.[1] EPA label values are designed for comparison, not for forecasting an individual journey.[4] A driver who understands those limits is better prepared than a driver who has memorised a single percentage. The budget is useful precisely because it makes assumptions visible and allows them to be revised as conditions change.[1][4]
A defensible planning procedure has five steps. First, specify distance, duration, ambient temperature and cabin set point. Second, partition expected energy into traction, cabin heating and thermal-management components, using distance-based and time-based terms respectively. Third, run sensitivity cases by varying duration and set point, which reveals whether time or distance dominates the budget. Fourth, apply operational measures supported by the evidence, including preconditioning while plugged in, targeted seat and steering-wheel heating, proper tire inflation, and avoiding sustained high speeds in extreme temperatures.[1] Fifth, retain an uncertainty margin rather than a point estimate.
The procedure must also state its exclusions. It does not provide battery-health advice, purchasing advice, installation or repair instructions, or a prediction for a specific vehicle, because the supplied evidence does not support those claims.[1][2][3] The AAA sample of three electric vehicles and three hybrids, the EPA label methodology, and the general battery-chemistry descriptions each support limited inferences within their stated scopes.[1][2][4] A checklist that respects those scopes is more useful than a false-precision forecast, because it directs attention to the variables a driver can actually observe and adjust before departure.[1][4]
Sources & further reading
Explore the references behind this guide. External pages may change after our review.
- AAA Study Reveals Temperature Impacts on EV and Hybrid Efficiencies and Costs – AAA NewsroomAmerican Automobile Association (AAA) · Accessed 6 Nov 2026
- Alternative Fuels Data Center: Batteries for Electric VehiclesU.S. Department of Energy / AFDC · Accessed 6 Nov 2026
- Alternative Fuels Data Center: How Do All-Electric Cars Work?U.S. Department of Energy / AFDC · Accessed 6 Nov 2026
- Fuel Economy and EV Range Testing | US EPAU.S. Environmental Protection Agency · Accessed 6 Nov 2026
Article updated 6 Nov 2026.
Found something we should revisit?
Good explanations get better with thoughtful feedback.