What you’ll take away
- Pass@k measures whether at least one candidate passes within a stated attempt budget.
- The finite-pool combination estimator and a known-probability fresh-generation calculation condition on different information.
- Two systems can reverse their average ranking when k changes, even with unchanged candidate outcomes.
- Sample counts, valid k values, task weights and test conditions belong beside the score.
- Measure the chosen answer separately; finding a passing candidate somewhere does not specify a working selector.
A successful candidate somewhere in the set is a particular result
A system that produces ten answers and gets one of them through a test has achieved something useful. It has not necessarily produced a correct first answer, or identified which answer a person should use. That distinction is central to pass@k, a measure often used when evaluating generated code. The k describes how many candidates are considered. A task counts as covered when at least one candidate passes the specified tests. Averaging over tasks then gives a score for that candidate budget. [1]
We will work through an invented pool of ten candidates, exactly two of which pass. We will count every possible group of three, compare that result with choosing one candidate, and construct two fictional systems whose ranking reverses when k changes. The examples contain only candidate labels and declared pass/fail outcomes; no model generated code and no candidate program was executed. This makes the arithmetic inspectable without presenting the result as a real model benchmark. It also keeps three questions separate: whether a passing answer exists in a set, whether a selection process finds it, and whether the tests establish the behavior a user actually needs. A score can answer the first question while leaving the other two unresolved.
Pass@k is a coverage measure over a candidate budget: a problem is counted as solved when at least one of k generated samples passes its specified unit tests, and the score is aggregated over problems. Chen et al. describe this interpretation and an estimator using n≥k evaluated samples per task [1]. It is not, without an additional selection protocol, the success rate of the particular candidate delivered to a user.
This article separates the conditional combinatorial interpretation of a recorded pool from the statistical interpretation of repeated generation. Our original pool has n=10 candidate indices and c=2 passing indices. Exact enumeration gives its pass@3 quantity; a second original example demonstrates a model-ordering reversal after averaging across two tasks. These are calculations on stipulated Boolean outcomes, not executed coding evaluations. We then examine the sampling assumptions behind the estimator, the scope of the historical reference implementation, and the difference between test-passing coverage and selected-output reliability. The goal is to make a reported number reconstructable: candidate budget, sample count, task weighting, test definition and selection rule each identify a different part of the claim. Combining them into one unqualified accuracy label loses information needed to interpret the result.
Name the candidate pool and the event being counted
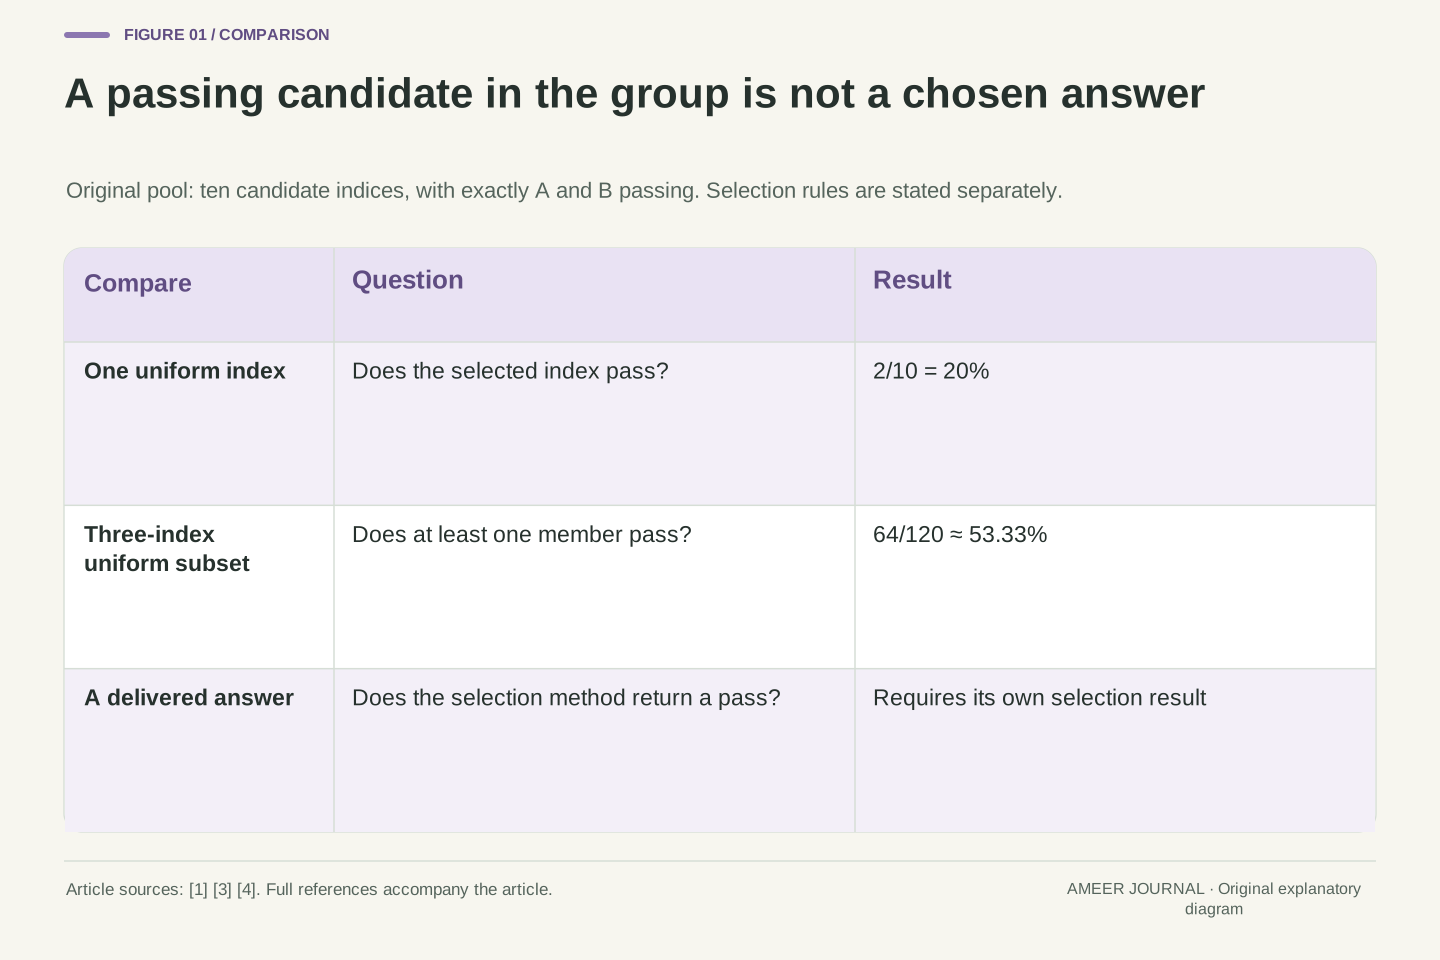
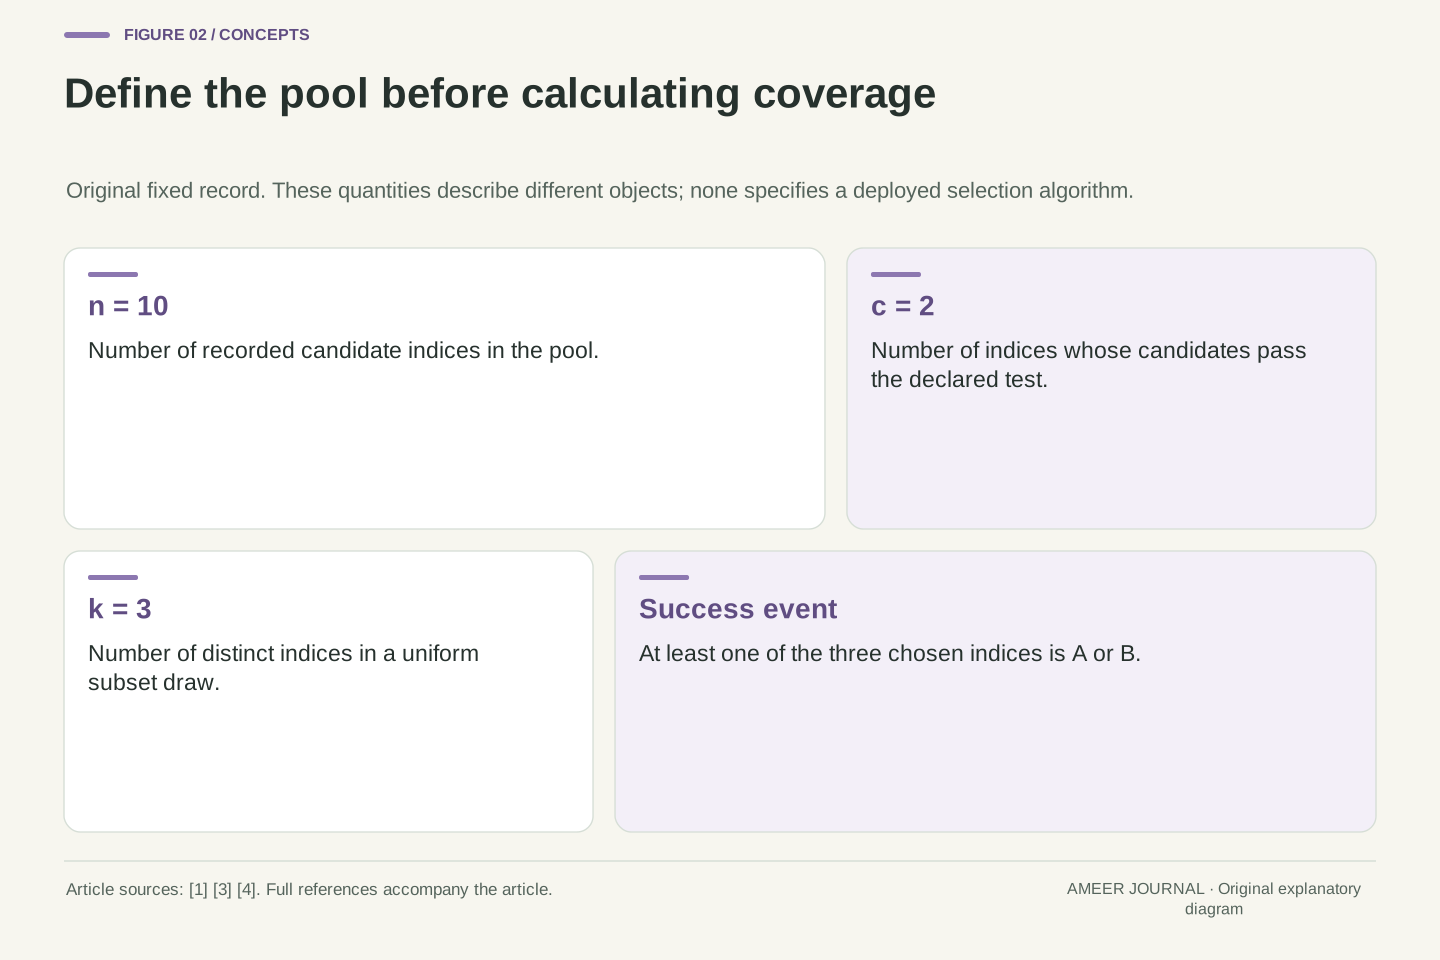
Label the ten recorded candidates A through J. In this invented record, A and B pass the test, while C through J fail. The number of candidates is n=10 and the number that pass is c=2. If you pick one of the ten labels uniformly at random, the chance of picking a passing candidate is two out of ten, or 20 percent. That is the pool's single-choice result. It says nothing about whether A was generated first or whether a ranking method would place it at the top.
For the next question, choose three different candidate indices uniformly from this fixed pool. We care only about whether their group contains A or B. Order does not change that event: the group A,C,D contains a passing candidate whether A is listed first or last. This is sampling without replacement, because an index cannot be selected twice in the same group. The hypergeometric distribution describes the number of successes in this kind of finite-population draw. [3] Candidate indices are the sampling units. Two separately recorded candidates could contain identical text; that does not turn their indices into one observation. If you deduplicate the pool, you have defined a different pool and must count its passing and failing members again.
Let the recorded index set be {A,B,C,D,E,F,G,H,I,J}, with success indicators equal to one only for A and B. Thus n=10 and c=2. Uniform selection of one index has conditional success probability c/n=0.2. This conditional statement neither assumes that the recorded first index is random nor evaluates a score-based selector. Those would be different selection rules applied to the same outcomes.
Now draw an unordered k=3 subset uniformly without replacement. There are C(n,k) possible index subsets. If Q denotes the number of passing indices in the chosen subset, its conditional distribution is hypergeometric. SciPy's versioned documentation uses parameters M for population size, n for population successes and N for draws; those correspond here to our n, c and k respectively [3]. Keeping that notation mapping explicit avoids accidentally using the candidate count twice. The event of interest is Q≥1, not an ordering of the three outputs. Recorded indices remain distinct even if their candidate strings repeat. Deduplicating strings changes the sampling population, its size and potentially its success ratio; it therefore changes the question being measured. The fixed-pool calculation itself does not establish independence or diversity of the process that originally produced those indices.
Count the groups with no passing candidate first
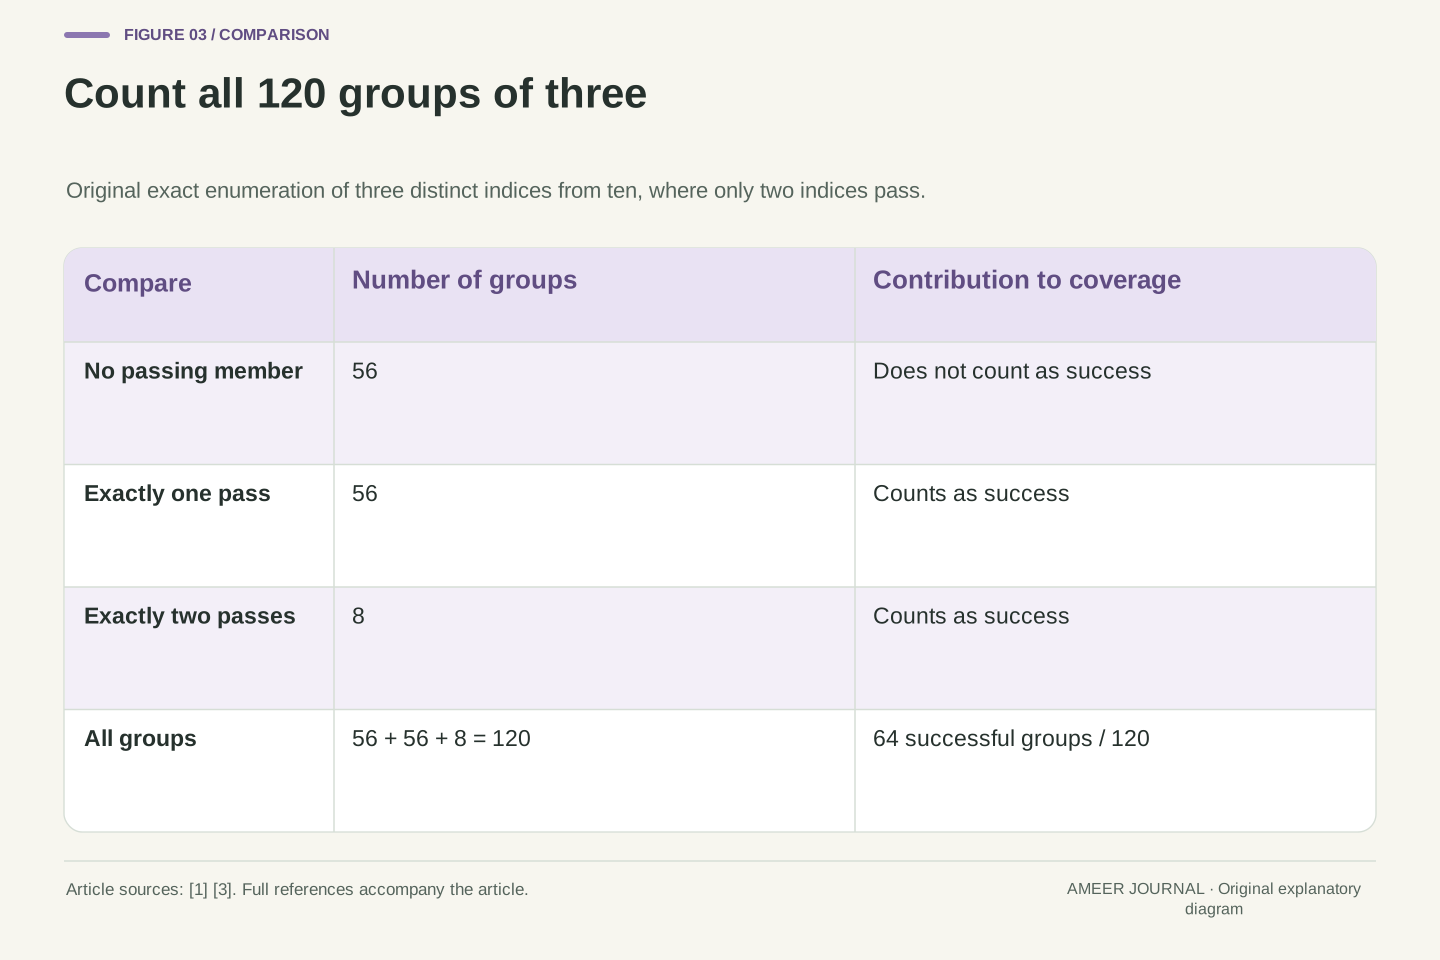
There are 120 different groups of three indices from ten. One way to calculate this is 10×9×8 divided by 3×2×1. The division removes the six different orderings of each group, since we are counting groups rather than lists. Eight indices fail. They form 56 all-failing groups of three: 8×7×6 divided by 3×2×1. Subtracting those 56 groups from all 120 leaves 64 groups with at least one pass. The resulting fraction is 64/120, or 8/15, approximately 53.33 percent.
We can check the answer by counting successes more closely. Exactly one pass can be chosen in two ways, A or B, and the remaining two failures can be chosen in 28 ways. That gives 56 groups with exactly one pass. Exactly two passes require A and B together, plus one of eight failures, giving eight more groups. The three counts are therefore 56 groups with no pass, 56 with one, and eight with two. They sum to 120. This calculation explains the estimator's subtraction: count the groups that cannot succeed, then remove their share from one. The paper and reference implementation use the same combination ratio, with a stable product form for numerical calculation. [1][4]
For valid integers 0≤c≤n and 1≤k≤n, the fixed-pool quantity is g(n,c,k)=1−C(n−c,k)/C(n,k), taking the all-failure numerator as zero when n−c<k. It is the complement of the hypergeometric probability P(Q=0) [1][3]. In our example C(10,3)=120 and C(8,3)=56, so g(10,2,3)=1−56/120=8/15. The result is exact for the stipulated uniform subset experiment.
The full success-count distribution independently verifies it: P(Q=q)=C(2,q)C(8,3−q)/120. The corresponding subset counts are 56 for q=0, 56 for q=1, and 8 for q=2; all other q values are impossible. Their total is 120 and their nonzero-success total is 64. We enumerated those subsets using local integer arithmetic, rather than importing or executing a benchmark harness. The reference estimator avoids forming large combination values directly, evaluating an equivalent product [4]. That computational representation does not change the event: at least one passing member among k distinct indices from the recorded n. Distinguishing the counted event from the implementation is useful when reviewing an unfamiliar evaluation script; a function name alone does not tell you its sampling unit, averaging convention or input domain.
A fresh generation experiment has another probability statement
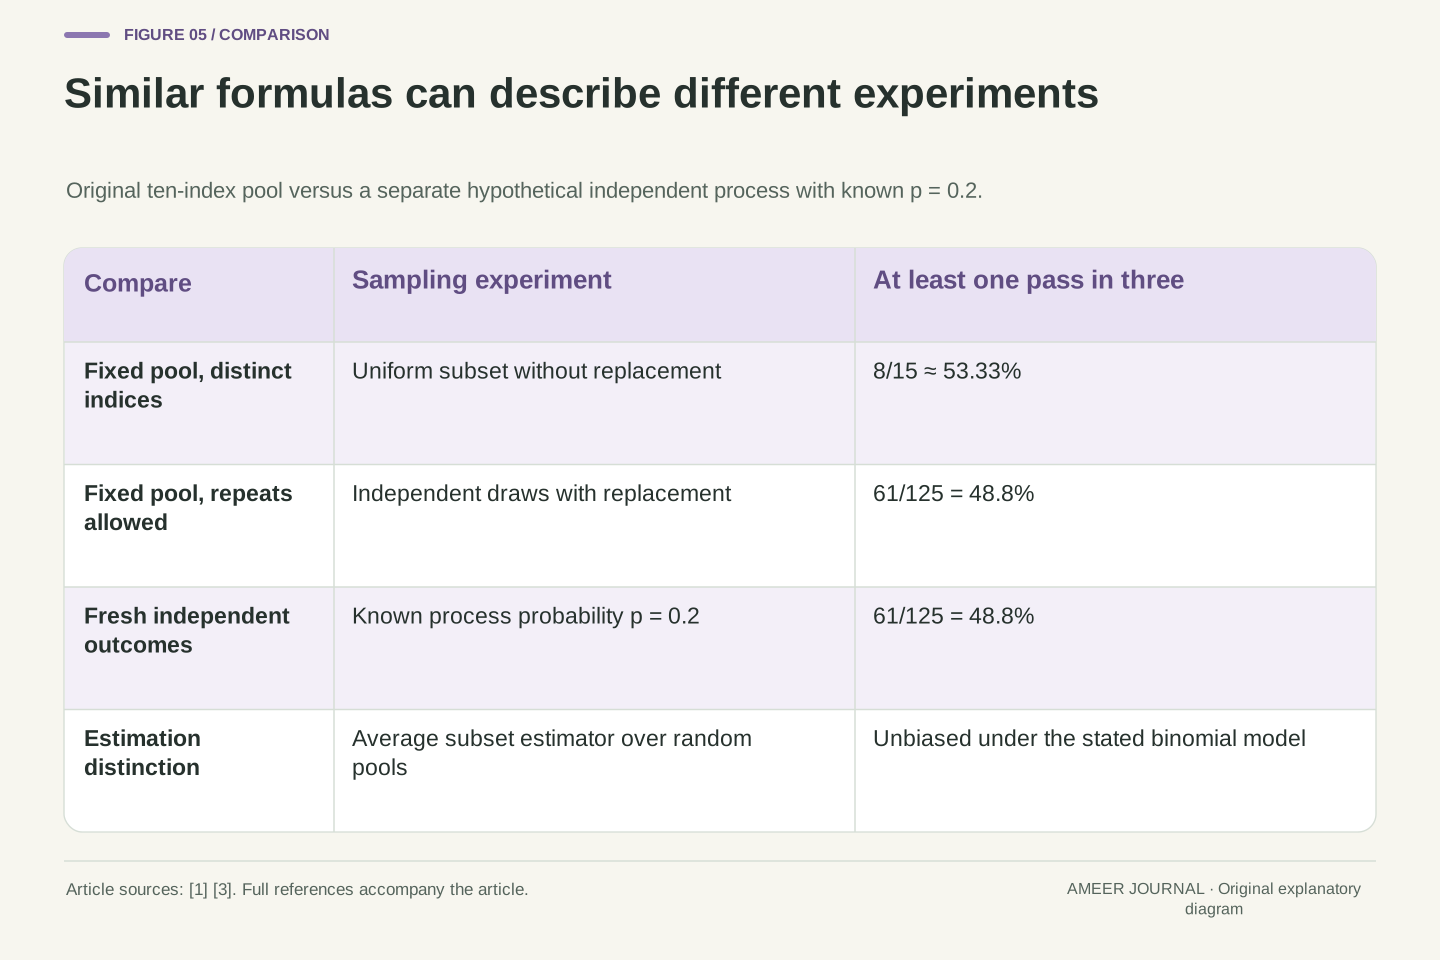
Suppose a separate, hypothetical generation process has a known 20 percent chance of passing on each attempt. Suppose also that attempts are independent and use the same conditions. The chance that all three fresh attempts fail is 0.8×0.8×0.8=0.512. The chance that at least one passes is therefore 1−0.512=0.488, or 48.8 percent. That differs from the 53.33 percent we calculated for three indices from our particular ten-item pool. The two calculations condition on different information: one fixes the pool and its two passes, while the other generates three fresh outcomes from an assumed process.
The connection is a statistical average. Imagine repeatedly drawing ten independent candidates from that process. Different pools will contain different numbers of passes. For each pool, calculate the combination-based result. Averaging that result over the possible pools gives the true three-attempt success probability, 48.8 percent in this assumed process. This is the unbiased-estimator property proved in the paper under its binomial sampling model. [1] It does not say every individual pool produces exactly the true probability. Our one pool happens to produce 53.33 percent. That is compatible with an estimator being unbiased across repeated pools; the property describes its average behavior, not certainty about a single observed record.
For a fixed task, assume independent, identically distributed Bernoulli pass indicators with success probability p. Then k fresh draws have at-least-one-pass probability 1−(1−p)^k. For the separate hypothetical parameter p=0.2 and k=3, this is 0.488. It is not the conditional probability obtained by selecting three distinct indices from a pool already known to contain exactly two successes.
If the n recorded samples follow that same independent sampling model, their pass count C follows Binomial(n,p). Appendix A proves E[g(n,C,k)]=1−(1−p)^k for n≥k [1]. The expectation is over the random recorded pool, whereas g(10,2,3)=8/15 conditions on one observed count. This distinction explains why the estimator's realized value can exceed or fall below the underlying success probability without contradicting unbiasedness. Adaptive prompts, related search branches or other dependencies require their own sampling analysis; the binomial proof cannot simply be transferred by retaining the function name. Nothing in the fixed-pool combination calculation verifies the generation protocol. Record the protocol separately and identify whether the reported interpretation is conditional coverage of recorded candidates or an estimate of success under repeated sampling from a defined process.
An observed single-pass fraction is not a known process probability
Our ten-item pool has a passing fraction of 0.2. It is tempting to insert that number into 1−(1−p)^3 and report 48.8 percent as the estimate. But an observed fraction is not the same thing as a known probability for the generation process. The arithmetic produces the chance of finding at least one passing index when drawing three times from this fixed pool with replacement. In that experiment, the same index may be selected again. The earlier 53.33 percent result chose three different indices without replacement. Each formula fits its own experiment.
When the goal is estimating the fresh-generation probability from independent sampled candidates, the paper explains that this plug-in method is biased downward in expectation, while the combination estimator is unbiased under the stated sampling model. [1] This does not mean you should alter an observed count until a score looks better. Keep the original n and c, apply the declared estimator consistently, and state what it estimates. A number taken from data carries sampling uncertainty even if its decimal representation is neat. For this example, 20 percent is exact as a description of the recorded ten-item pool; interpreting it as the true probability of a future attempt adds a statistical claim that the count alone cannot settle.
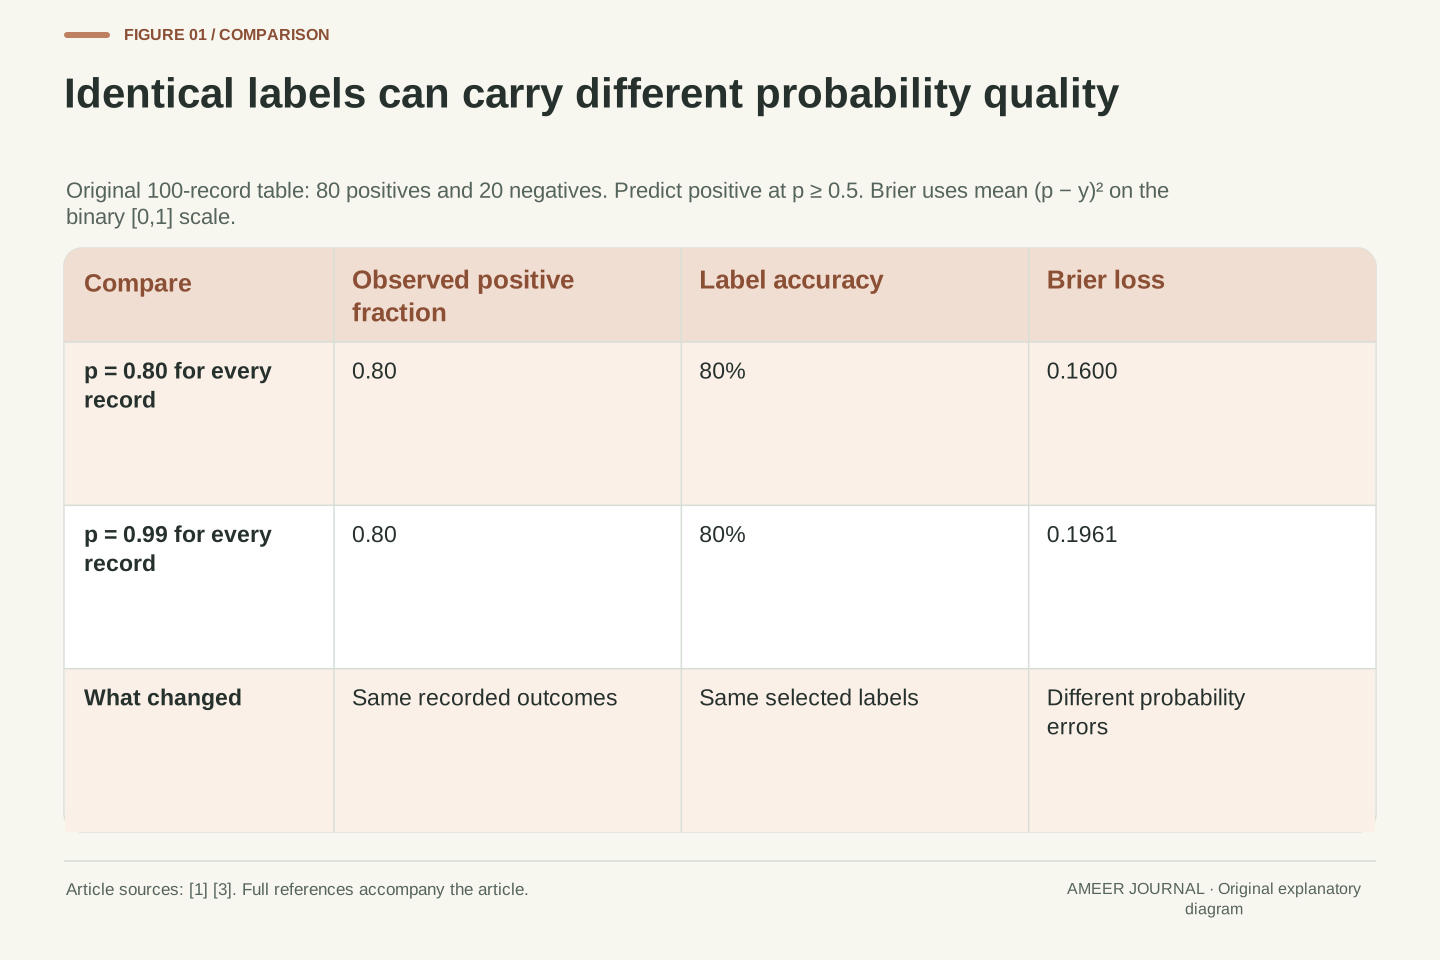
The plug-in quantity h(n,c,k)=1−(1−c/n)^k uses the empirical pass fraction as if it were the underlying Bernoulli probability. For n=10,c=2,k=3, h=61/125=0.488, while g=8/15≈0.53333. Conditional on the fixed pool, h is exactly the at-least-one-success probability for k independent index draws with replacement. By contrast, g describes a uniform k-subset without replacement. Repeated index selections are permitted only in the former conditional experiment.
As an estimator of 1−(1−p)^k under independent generation, h is generally downward biased in expectation for k>1; Chen et al. discuss this distinction and show why increasing the available n can change the plug-in bias [1]. Nonlinearity matters: replacing p by an unbiased estimate c/n does not automatically make a nonlinear function of that estimate unbiased. For k=1 the two expressions coincide at c/n. We do not infer an individual model's true p from this example, nor claim a bias direction for arbitrary dependent generation. Preserve the estimator definition, sample count and sampling assumptions when comparing evaluations. Two reports with the same label and k can still differ because one uses the plug-in expression and the other uses the finite-sample combination estimator.
Changing k can reverse the average ranking
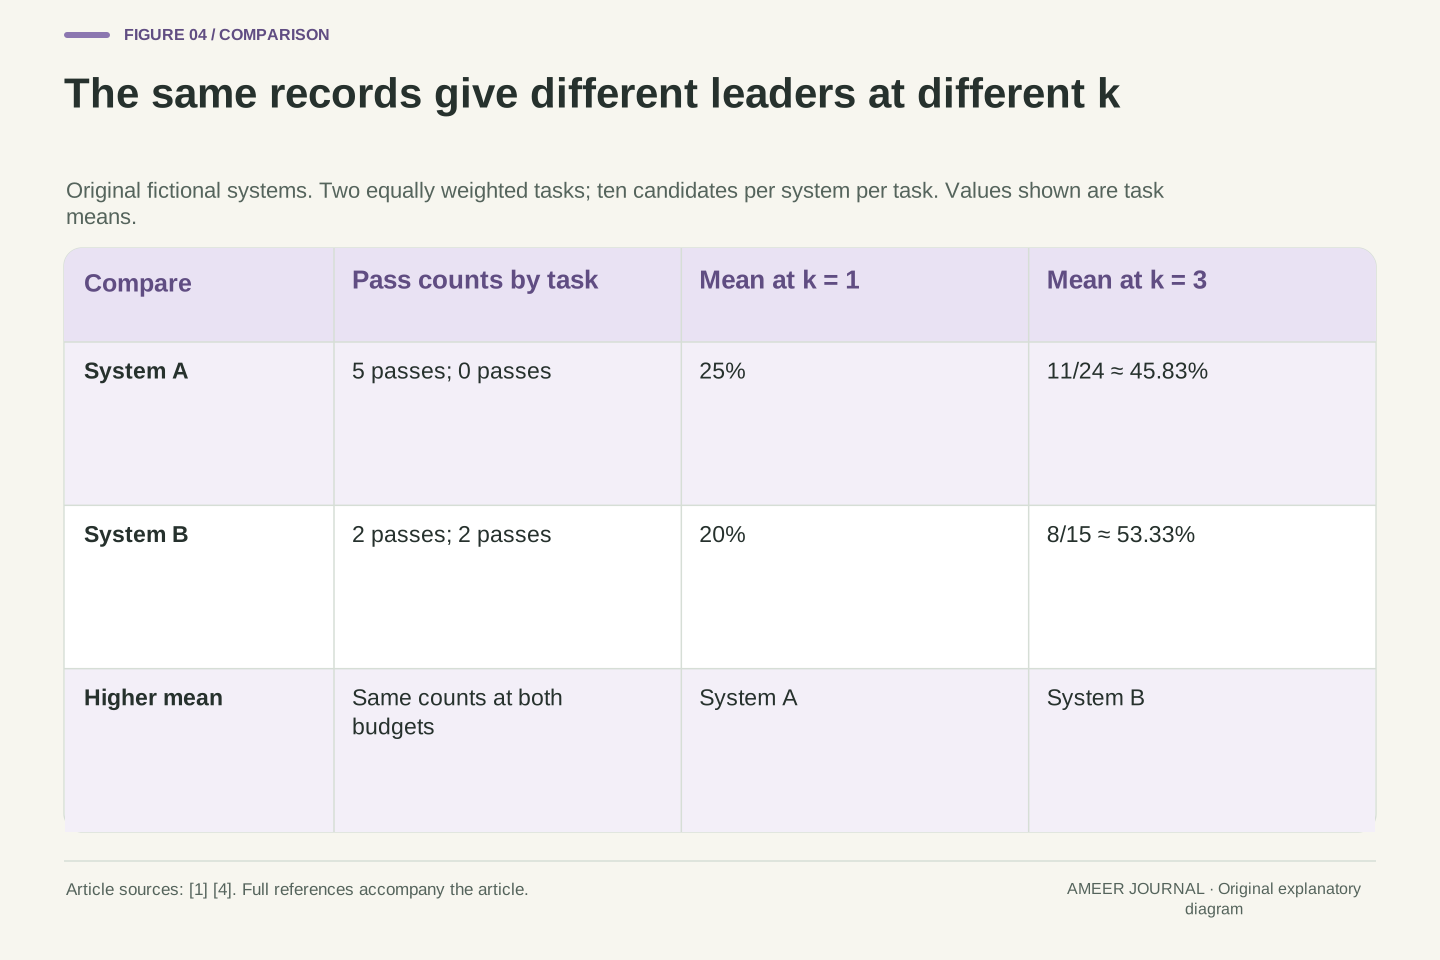
Consider two fictional systems, A and B, evaluated on the same two tasks. Each system has ten candidates per task. System A gets five passes on the first task and none on the second. System B gets two passes on each. Give the two tasks equal weight. At k=1, A averages (0.5+0)/2=0.25, or 25 percent. B averages (0.2+0.2)/2=0.20, or 20 percent. A therefore has the higher single-candidate score in these stipulated records.
At k=3 the ordering changes. A's first task has only five failing candidates, which form ten all-failing three-item groups out of 120. Its first-task result is 110/120, while its second-task result remains zero. Its two-task average is 11/24, about 45.83 percent. B's two tasks each have the earlier 8/15 result, so its average is approximately 53.33 percent. B now leads. No candidates or pass labels changed; only the candidate budget changed. This is a consequence of averaging a nonlinear coverage measure across tasks. The reference implementation calculates each task's estimate and then takes the mean. [4] A comparison should therefore show k beside the score and retain the task-level counts, rather than turn one ordering into a universal claim that one system is better.
Use two equally weighted tasks with n=10 per task. Stipulate system A pass counts (5,0) and system B counts (2,2). At k=1, their task means are A=(0.5+0)/2=0.25 and B=(0.2+0.2)/2=0.20. At k=3, A's first-task estimate is 1−C(5,3)/C(10,3)=11/12, its second is zero, and its mean is 11/24≈0.45833. B's mean is 8/15≈0.53333 because both tasks have that value. The ordering reverses without changing the recorded candidate outcomes.
The score is a mean of per-task coverage values, not generally the coverage formula applied once to pooled counts or to the mean pass@1. Nonlinearity and heterogeneity across tasks matter. System A concentrates all observed successes on one task; system B spreads them across both. This original table is a counterexample to treating a ranking at one k as a ranking at every k, not evidence about any real model. The retained HumanEval source computes the estimator per problem and applies an arithmetic mean [4]. Other benchmarks may use other task weights, eligibility rules or aggregations, which must be specified independently. Preserve task identities and denominators so changes in weighting, task inclusion and candidate budget remain distinguishable in a reported comparison.
A score of one can come from exhausting the failing members
Return to the ten-item pool with two passes. If you select nine different indices, you must include a passing one: only eight failing indices exist. The fixed-pool pass@9 quantity is therefore one. The same is true at k=10. That does not mean every candidate is correct. Eight of the ten still fail. It means a group that large cannot avoid both passing members. If the pool had no passes, its result would instead remain zero for every valid k.
The valid candidate budget also matters. You cannot select eleven different indices from a pool of ten. The historical HumanEval evaluator reports a requested k only when every included task has at least k recorded samples. [4] The accompanying README explains the insufficient-sample limitation. [2] An omitted score should not be silently filled with zero, and it should not be manufactured by reusing the same indices while keeping the without-replacement description. Reusing indices defines another experiment. The number n says how many evaluated candidates support the calculation; k says how many attempts the metric is considering. Write both numbers down. Their roles remain different even when a particular run happens to use n=k.
Within 0≤c≤n and 1≤k≤n, g(n,c,k)=1 whenever n−c<k because an all-failure k-subset is impossible. Thus g(10,2,9)=g(10,2,10)=1 even though eight recorded candidates fail. With c=0, g is zero for every valid k; with k=1, it equals c/n. These boundary cases clarify that the metric measures set coverage rather than the correctness of each member [1][4].
The domain restriction is external to some low-level implementations. The retained evaluation source filters requested k values with an all-tasks n≥k condition before aggregation [4]; its inner estimator should not be treated as a complete input validator. For n<k the uniform k-subset experiment is undefined. Missing estimates therefore require an explicit reporting policy, rather than an arbitrary zero, one or silently changed denominator. The README documents the estimator's insufficient-sample constraint [2]. Record per-task sample counts when they vary, identify which tasks enter a mean, and disclose any exclusions. A result computed on a reduced task set may be mathematically valid for that set while ceasing to be comparable with a mean over the original full evaluation population.
Finding a passing candidate requires a separate selection method
Suppose someone receives the entire original ten-item pool but no pass/fail labels. Choosing one index uniformly still succeeds only 20 percent of the time. Knowing that a three-item group often contains a pass does not tell them which member to choose. A practical system might rank candidates, run available checks, ask for another attempt, or deliver the first answer. Each procedure has its own result, and none is specified merely by writing pass@3 beside a score.
In the invented record, a perfect selector that can recognize a passing candidate whenever one exists would succeed on all 64 successful three-item groups. A selector without that ability can do worse, even though the candidate groups themselves have not changed. This is a reasoning example, not a claim that a real verifier is perfect. It explains what to measure next: the actual chosen output under the actual selection rule, alongside the candidate-set coverage. If a system uses tests to select an answer, describe which tests it can see and which tests define the reported evaluation. Otherwise, the phrase “the system got it right” may hide whether success means producing one acceptable possibility or reliably delivering it. Those are both useful measurements, but they answer different reader questions.
Coverage is an existence event. For a sampled set S, pass@k records whether any member passes the evaluation predicate. A deployed selector returns a particular member, or perhaps declines to return one; evaluating that behavior requires a specified selection policy and outcome definition. The coverage statistic does not encode the policy. Uniformly selecting one index from the original ten-item pool has conditional success probability 0.2 regardless of the pool's g(10,2,3) value.
A perfect selector with access to the relevant pass labels would attain the fixed-set coverage event whenever a passing member exists. A real selector's success can be lower. This is an original implication of the metric definition, not an empirical verifier-performance claim. Moreover, a verifier may use different evidence from the final evaluation predicate. Distinguish generation, available selection checks and final assessment when interpreting a combined system. Report chosen-output success separately and state whether rejection or abstention is allowed. That separation prevents an oracle-style existence metric from being presented as the reliability of an answer a user will actually receive. It also permits a useful diagnosis: a candidate-generation improvement and a selection improvement can affect different measured quantities even when the final application reports only one answer.
Passing the recorded test does not define every useful behavior
In the source paper's coding evaluation, correctness is operationalized through the supplied unit tests. [1] A program that passes those tests has met that particular test condition. The score alone does not establish that it behaves correctly for every possible input, protects every kind of data, or meets a different project's requirements. Our examples simplify the same boundary further by declaring pass/fail labels directly. They prove arithmetic about those labels, not that any real program is correct.
Evaluation conditions can also affect the labels. The historical repository distinguishes passed, timed-out and failed execution results, and its README notes that resource problems can cause otherwise correct programs to fail. [2] Preserve the test definition, time and resource conditions, and failure-handling rules beside the counts. A changed limit can change c without changing the candidate text. This article is an explanation of the metric and its reference records, not instructions to run generated programs. The repository is now marked deprecated and unmaintained, so it is used here as a historical primary source for the estimator rather than a recommendation for a new evaluation installation. [2] The calculation remains understandable while its software provenance and practical execution scope stay explicit.
The binary outcome is relative to an evaluation predicate. Chen et al. define the coding metric using unit-test passage [1], and the retained harness records passed, timed-out or failed results [2][4]. A statement about that predicate is narrower than proof of total functional correctness, security or fitness for another task. Our stipulated Boolean arrays contain no executable candidates, so the independent computation validates only the combination and averaging arithmetic.
The predicate includes operational conditions as well as test inputs. Timeouts, resource limits and treatment of execution errors can affect observed c; the README explicitly notes memory-related failures [2]. Retain those conditions when comparing records, and avoid changing them invisibly between systems. The repository's current README marks it deprecated and unmaintained [2]. We therefore reference its preserved source to explain historical estimator behavior, not to assert current maintenance or recommend executing its harness. A reproducible evaluation report needs identifiable tests, generation conditions, runtime conditions and aggregation rules. A high coverage score under one such protocol does not independently certify a different protocol. This scope statement follows from what the measured pass indicator represents; it is not an adjustment to the score or a reason to discard properly bounded evidence.
Read the score with its budget, denominator and decision rule
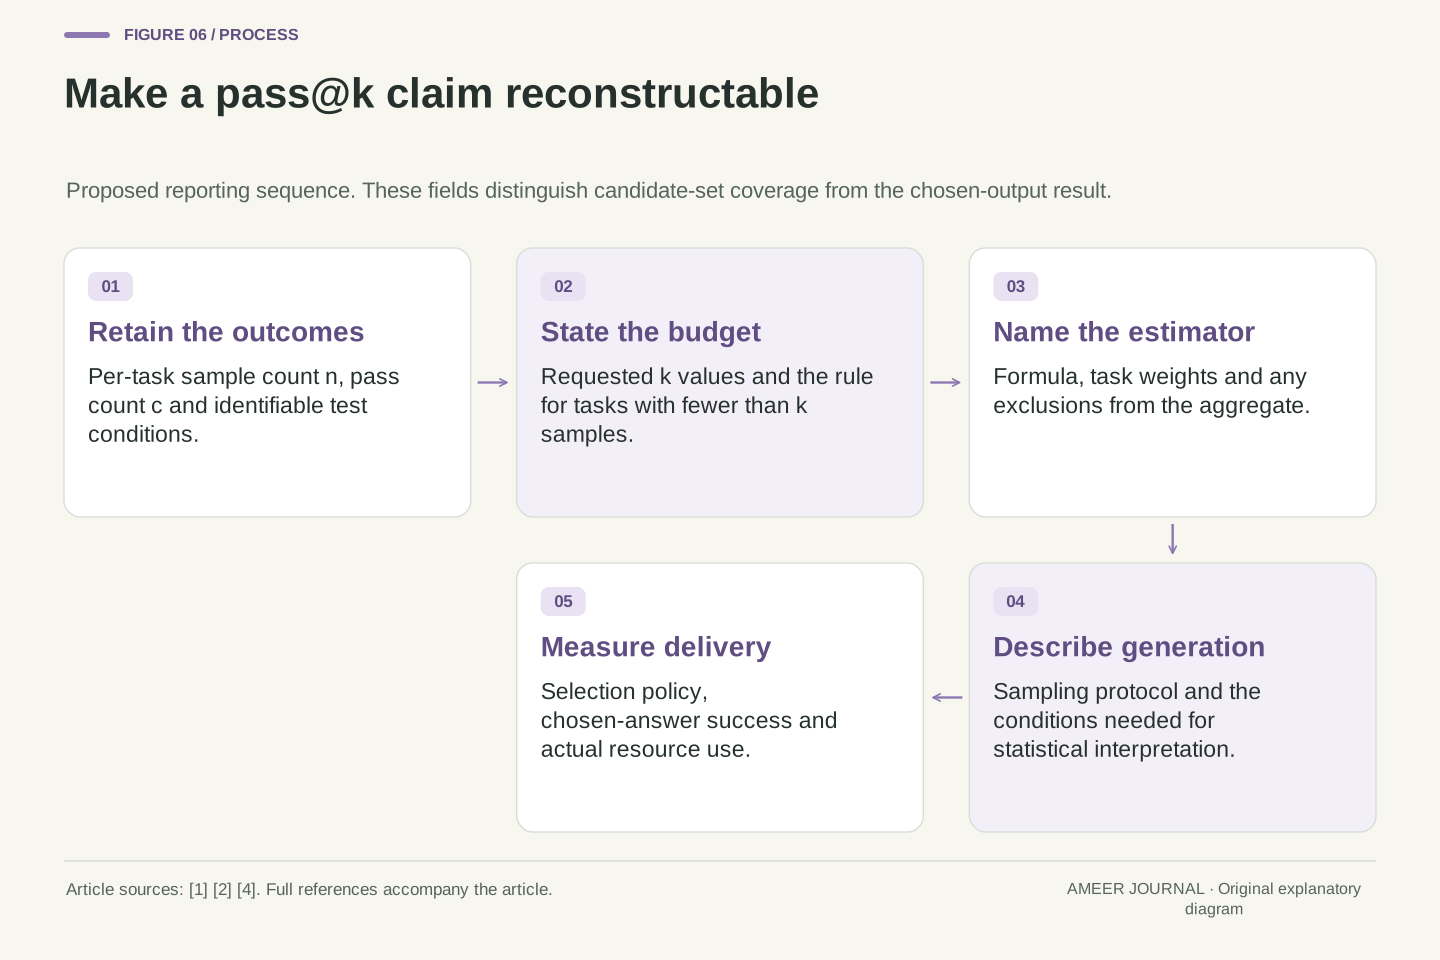
A useful report lets you reconstruct the question before judging the number. For each task, retain how many candidates were evaluated and how many passed. State the requested k values, the estimator, the task set and its weights. Describe how candidates were generated, what counted as passing, and whether the reported result concerns any successful candidate or the one actually selected for use. If costs matter, record them directly. Three candidates do not automatically represent the same time, output length or computing expense across two systems.
The worked record now gives us several compatible results. One uniform choice from the ten-item pool succeeds 20 percent of the time. A uniform three-index subset contains a pass in 64 of 120 cases, approximately 53.33 percent. A separate independent process with known 20 percent success per attempt has 48.8 percent three-attempt success. Finally, the two-task example changes its system ordering when k changes from one to three. None of these numbers needs to replace the others. Each answers a defined question. Keeping that question beside the score makes pass@k useful evidence about a particular evaluation, while leaving first-choice reliability, selection quality and real application behavior to the measurements that assess them.
Retain per-task (n,c) records, valid k values, estimator definition, task eligibility and aggregation weights. Add model and generation configuration, test and runtime identity, selection policy and separately measured resource use. The historical combination estimator and its per-task mean provide one clearly specified convention [1][4]; they do not make all reports carrying the pass@k label interchangeable. Candidate count is a budget dimension, not a direct conversion into latency, token use or financial cost.
For our fixed ten-index pool, c/n=1/5 and g(10,2,3)=8/15. For the distinct independent-generation assumption p=1/5, the true three-draw probability is 61/125, and the expectation of g across random ten-sample pools equals that value. The original two-task table shows A leading at k=1 and B leading at k=3. These exact results establish why conditioning, estimation and aggregation must remain explicit. They do not evaluate an actual model or a selector. Interpret a published score by reconstructing its event and protocol first, then use additional measurements for the particular deployment decision. This preserves the metric's legitimate information while preventing a set-level success event from silently becoming a claim about every answer, every attempt budget or every user outcome.
Sources & further reading
Explore the references behind this guide. External pages may change after our review.
- Evaluating Large Language Models Trained on CodeChen et al. / arXiv · Accessed 6 Nov 2026
- HumanEval reference repository READMEOpenAI HumanEval · Accessed 6 Nov 2026
- scipy.stats.hypergeom — SciPy v1.16.0 ManualSciPy · Accessed 6 Nov 2026
- HumanEval evaluation.py reference estimatorOpenAI HumanEval · Accessed 6 Nov 2026
Article updated 6 Nov 2026.
Found something we should revisit?
Good explanations get better with thoughtful feedback.