What you’ll take away
- Objects, source observations, derived inputs and stored files require different counting units.
- Two train/test splits can have identical row counts and different shared-object membership.
- A group percentage does not automatically equal the same percentage of rows.
- Document transformation lineage and keep unreviewed annotation states distinct from negative labels.
- Match the card to the exact data revision, assignment rule and processing stage it describes.
A dataset can have eight objects, twenty-four photographs and eighty-four training-and-test records
Suppose you find an image dataset described as “84 examples”. Before deciding whether it suits your project, ask what an example means. It could be a photograph, a crop from a photograph, or a record that points to an image stored elsewhere. That count does not automatically tell you how many different objects were photographed.
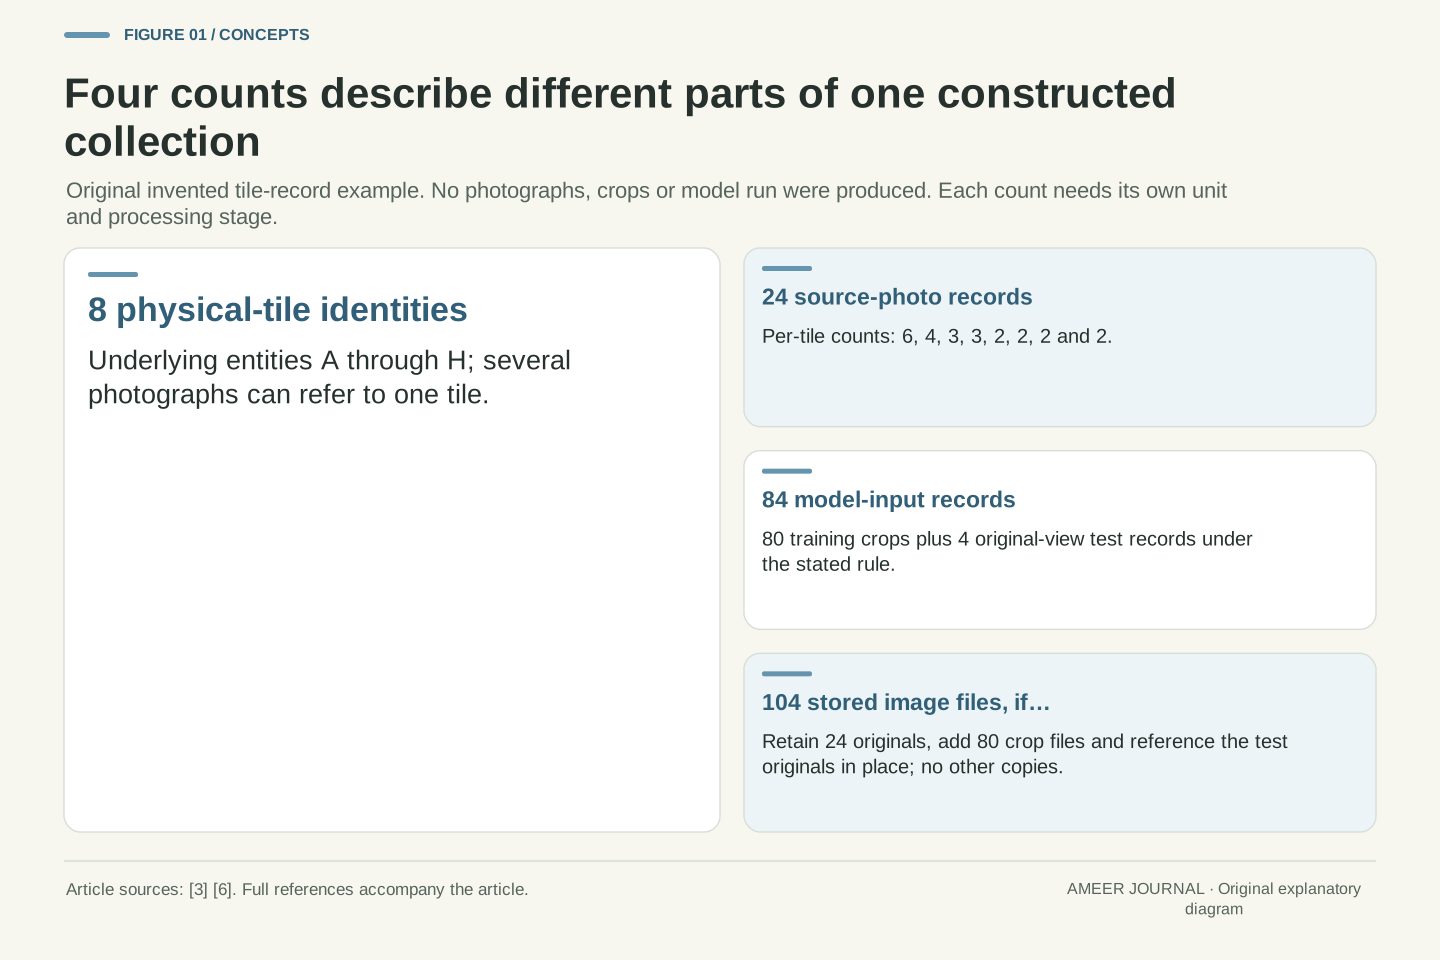
We will build an original bookkeeping example using eight imaginary tiles, labelled A through H. Their photograph counts are six, four, three, three, two, two, two and two: twenty-four source photographs altogether. A later processing rule will turn twenty training photographs into eighty crop records while leaving four test photographs unchanged. The result has eighty-four model-input records, but still only eight underlying tiles. These are invented identifiers and labels; no photographs were collected or model trained.
A dataset card is the explanation that travels with such a collection. Hugging Face renders a repository's README as its card and supports additional metadata for discovery and description. [2] The useful question is not whether the card looks complete at a glance. It is whether a reader can connect its numbers to the actual counting units, source relationships and processing choices needed to interpret the data.
Distinguish entity count, source-observation count and derived-record count. In our constructed manifest, eight physical-tile identifiers produce twenty-four source-photo identifiers with per-tile multiplicities (6,4,3,3,2,2,2,2). A specified split and transformation later produce eighty training crop records plus four unchanged test records. The cardinalities 8,24 and 84 describe different sets; none is a substitute for another.
The example consists entirely of invented identifiers, class assignments and annotation flags. It is an accounting construction, not an image collection, benchmark, library execution or empirical assessment. Its purpose is to make the documentation requirements testable: a reader should be able to recompute each count and trace a derived row back to the source observation and entity it represents.
On the Hugging Face Hub, the README serves as the human-readable dataset card, with YAML metadata describing additional properties [2]. Our proposed documentation connects that descriptive layer to an explicit manifest. A syntactically valid table can still omit the semantic unit required to interpret its size. State whether each statistic counts entities, observations, derived records or stored files before drawing conclusions about coverage, split membership or the information available to a model.
The searchable label and the explanation do different jobs
A short metadata field is useful when you want to find a dataset. It can identify a language, task or stated license without making you read every page. The Hub documentation describes these fields and their role in filtering and display. [2] But a label such as “image classification” cannot explain why one tile appears six times and another only twice.
The written card has room for that explanation. The original Datasheets for Datasets proposal describes documenting a collection's motivation, composition, collection process and recommended uses. [1] The current Hugging Face template also asks about fields, relationships between records, split criteria, processing and annotations. [3] These questions encourage a reader to investigate what the data represents, rather than treating a row count as a complete description.
For our imaginary collection, a useful opening would say that the task concerns plain versus striped tiles, that several photographs may show the same tile, and that training crops inherit their source-photo identity. It would also state that the numbers are a teaching example. A task tag can help someone discover that card; the narrative explains how to read it. Neither a polished description nor a license field should be presented as proof of an unperformed quality, rights or suitability assessment.
Separate structured discovery metadata from the semantic documentation required for use. The Hub's YAML fields include properties such as language, license and size, while the README supplies context [2]. Machine-readable labels can route a search or configure a display without encoding the entire collection design, lineage graph or measurement population.
The historical datasheets proposal motivates documenting composition and collection alongside intended uses [1]. We use that proposal for its documented purpose, not to repeat its 2021 statement about the absence of standardization as a claim about the present. The inspected card template explicitly calls for split criteria, relationships between data points, processing, annotation methods and limitations [3]. Filling headings with unsupported assurances would not answer those questions.
In our proposed card, the task is a stipulated plain/striped classification exercise; tile_id denotes an entity, photo_id denotes a source observation and record_id denotes a model-input record. A paragraph explains multiplicity and the training-only transformation. These definitions complement metadata rather than duplicating it. The card reports what is known, identifies its basis and leaves unresolved matters explicit. We do not infer legal permission, annotation accuracy or downstream fitness merely from the presence of a tag or a completed template.
Give the photograph and the photographed object separate identities
Name the six photographs of tile A as A-01 through A-06. Each has its own photograph identifier, but all share tile identifier A. This small distinction makes an important question answerable: do two rows show different objects, or different views of the same object? A filename alone may not express that relationship.
In our example, the pattern label belongs to the tile: A, B, C and G are plain; D, E, F and H are striped. A separate quality flag belongs to each photograph, because different views of one tile can have different recorded quality. The card should explain which level each field describes. It should also define allowed values and the meaning of a missing entry. The template's request for field descriptions and relationships is directly relevant here. [3]
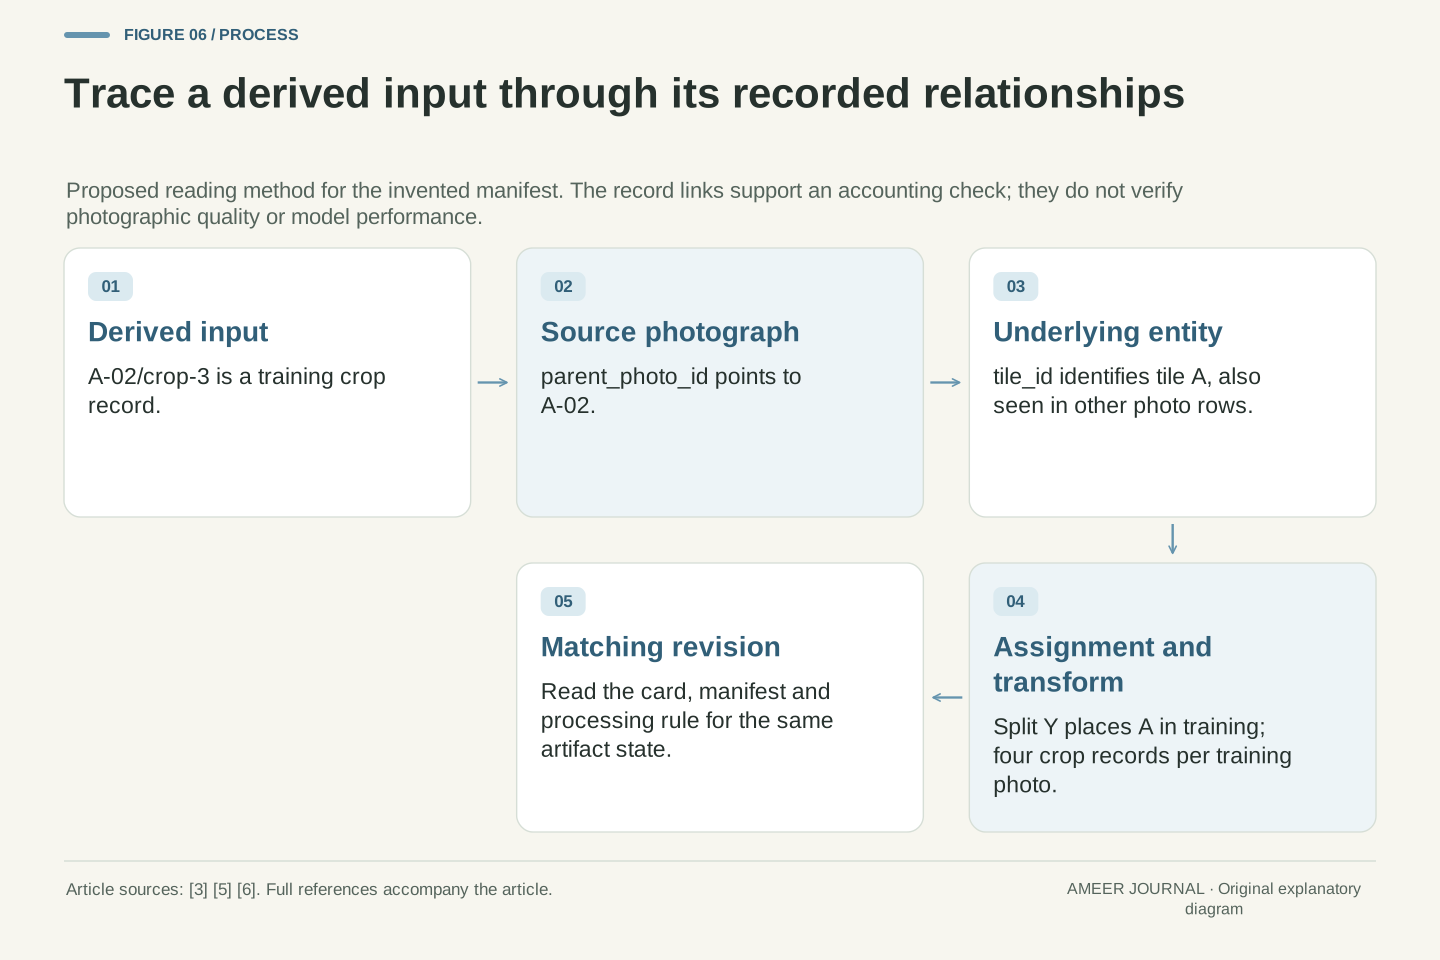
After cropping, a derived record needs another identity and a reference to its parent photograph. For example, A-02/crop-3 points to photograph A-02, which points to tile A. This lineage is a proposed design for our construction, not something every data tool automatically supplies. It allows a reviewer to follow a record through transformations without pretending that a new filename creates a newly observed tile.
Use distinct keys for the levels of the constructed relation: tile_id identifies the physical entity, photo_id identifies a source photograph and record_id identifies a derived model-input record. A parent_photo_id connects each crop to its source. For example, record A-02/crop-3 has parent A-02 and entity A. The identifier hierarchy makes a many-to-one relationship explicit.
The stipulated pattern attribute is entity-level: tiles A,B,C,G are plain and D,E,F,H are striped. A quality_flag is observation-level and may differ between photographs of one tile. Conflating these fields would obscure what a label correction or missing value refers to. The card template asks for fields, data-point relationships and annotation information [3]; our schema gives those questions concrete answers.
Document field type, allowed values, null semantics and the procedure that produced the value. A string identifier is not itself evidence that the underlying identity was assigned correctly. Likewise, a byte-for-byte duplicate check would answer a different question from whether different photographs depict the same object. Our example assumes the stated identities are correct and uses them for exact accounting. It does not claim an automated entity-resolution process or that a library preserves parent identifiers without an explicit implementation.
Two twenty-and-four splits can contain very different relationships
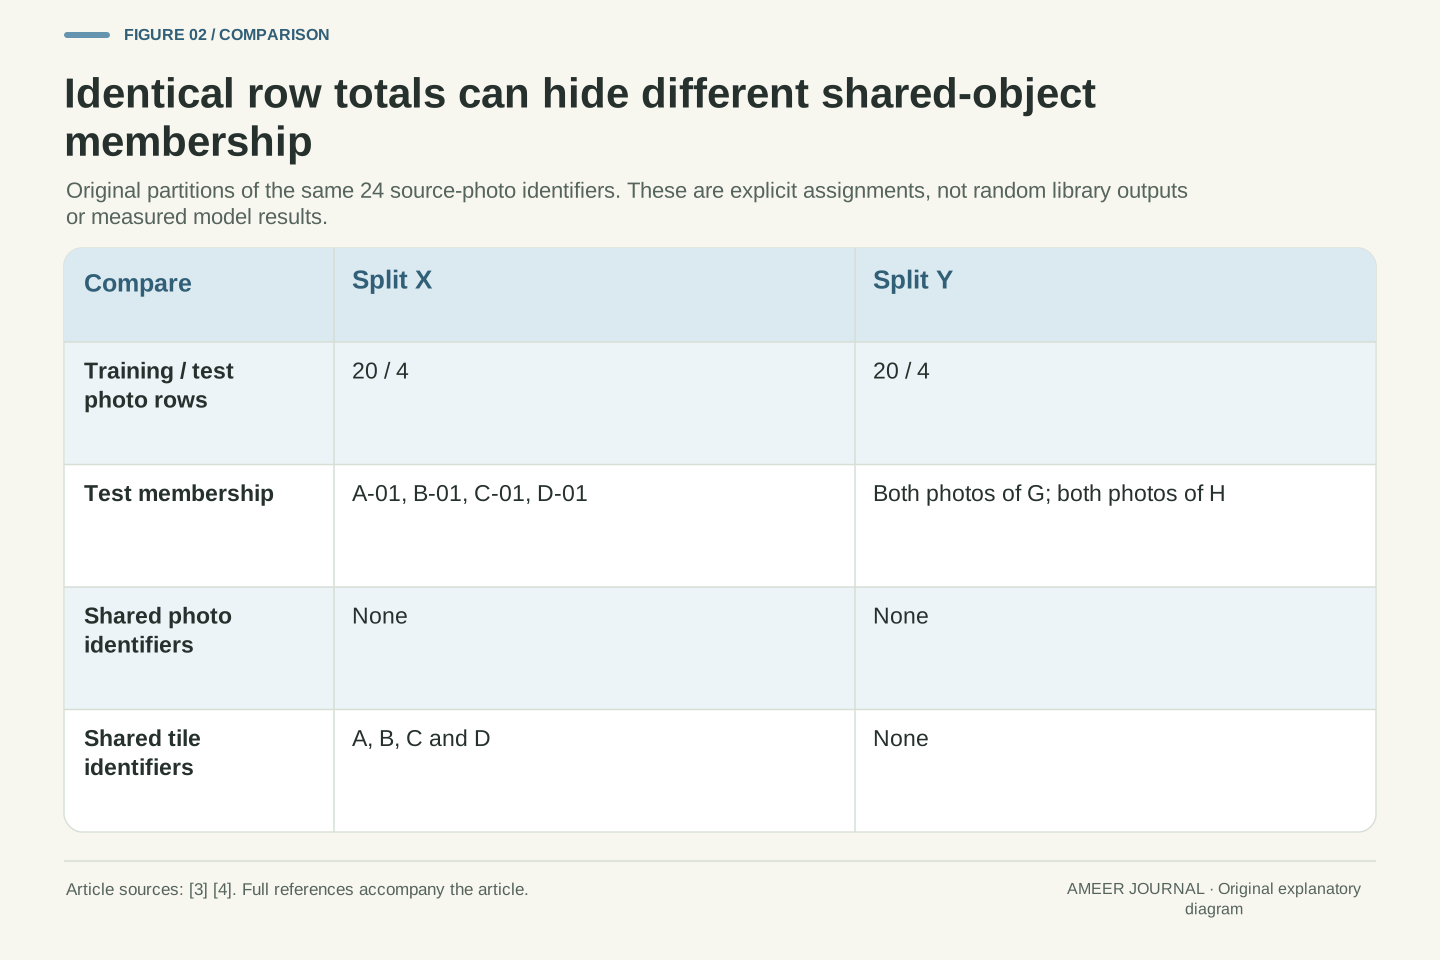
Create split X by putting A-01, B-01, C-01 and D-01 into the test set, and every other photograph into training. There are twenty training photographs and four test photographs. Each test tile also appears in training through another photograph. The photograph identifiers do not overlap, but the tile identifiers do: A, B, C and D are shared.
Now create split Y. Put all photographs of G and H into the test set, and all photographs of A through F into training. The row counts are still twenty and four. This time, the training and test sets share no tile identifiers. A card that lists only those row counts would make the two arrangements look identical.
The right split depends on the question. A study of additional views of already-seen objects and a study of unseen objects ask different things. Our example does not measure the performance difference between them. It shows why the grouping rule belongs in the card. Group-aware splitting is an explicit feature of scikit-learn's GroupShuffleSplit. [4] Our two assignments are hand-defined examples, so no particular software seed or random split is being claimed.
Define X_test={A-01,B-01,C-01,D-01} and assign the complement of the twenty-four source rows to X_train. Source-photo intersection is empty, but the projected entity intersection is {A,B,C,D}. All eight tile identities remain represented in X_train because each selected test photograph has another source photograph of that tile in the complement.
Define Y_test as every photograph whose tile_id is G or H. Since each of those tiles has two photographs, Y_test again contains four rows and Y_train contains twenty. Now the entity sets are {G,H} and {A,B,C,D,E,F}, with empty intersection. The two partitions have identical row cardinalities but different entity-overlap properties.
The distinction is relevant to the intended generalization question, not a numerical performance claim. GroupShuffleSplit documents group-based splitting [4], but neither constructed partition was obtained by running it. A useful card records assignment criteria and retained membership, allowing a reader to evaluate overlap at the declared unit. Entity-disjoint membership does not by itself guarantee independence at every other level: capture session, background or acquisition source could still be shared. Our construction makes no claims about such unrepresented factors.
Twenty-five percent of the objects need not be twenty-five percent of the rows
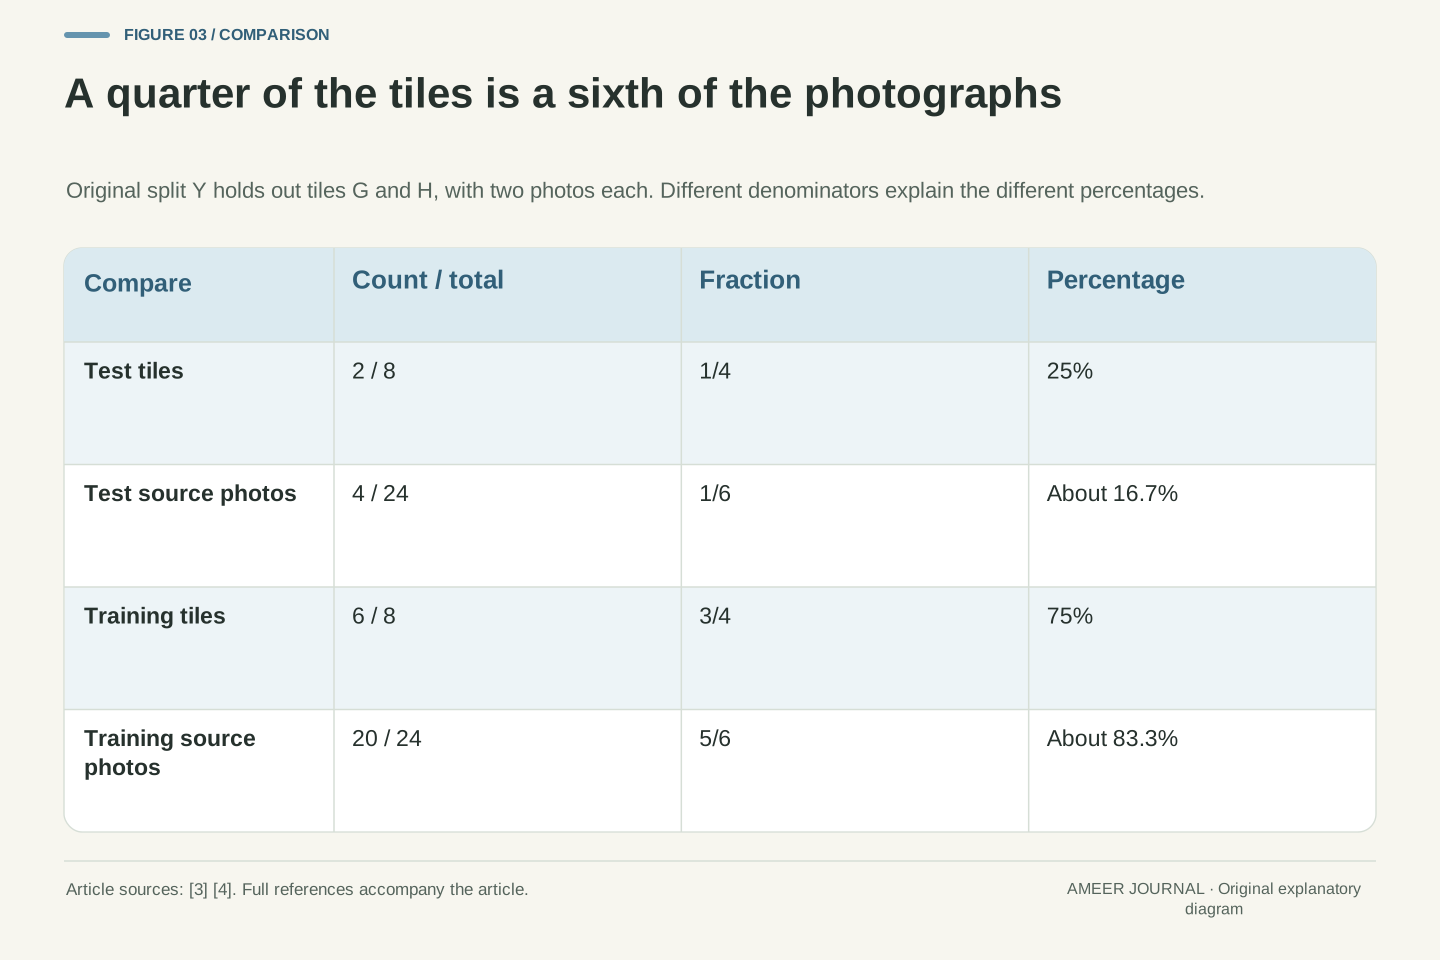
In split Y, the test set contains two of eight tiles, so it contains 25 percent of the objects. It contains four of twenty-four photographs, so it contains about 16.7 percent of the rows. Both percentages are correct. They have different denominators because the tiles were photographed different numbers of times.
This distinction also appears in a real API. GroupShuffleSplit defines its fractional test_size in terms of groups, not individual samples, and rounds the requested group count up. [4] That definition matters when you read a configuration or report. A 25 percent group setting is not a promise that exactly 25 percent of all rows will be in the test set. Which groups are selected also matters when their sizes differ.
Our manually selected G-and-H test set illustrates the counting issue without claiming to reproduce that API's random choice. The card should name the grouping field, show group and row counts, and retain the actual assignment. If several random splits are used, distinguish the separation within one split from separation between repeated test sets. The documentation notes that repeated GroupShuffleSplit test sets can overlap. [4] A single percentage hides all of these details.
For Y, the test-entity fraction is 2/8=1/4, whereas the test-row fraction is 4/24=1/6. The complementary training fractions are 6/8=3/4 and 20/24=5/6. Unequal group multiplicities make entity and row fractions different even though the membership partition is exact.
The GroupShuffleSplit documentation defines float test_size as a proportion of unique groups, rounded up, and explicitly distinguishes group counts from sample counts [4]. Thus a parameter value of 0.25 is interpreted at the group level. It does not constrain every resulting row fraction to 0.25. Our chosen membership {G,H} is an analytical example; no library call, random state or empirical distribution over splits was executed.
Retain the group definition, requested parameter units, actual selected group identifiers and resulting row counts. If repeated random partitions are reported, document each membership or a reproducible procedure with its implementation context. The API does not guarantee mutually exclusive test sets across repetitions [4]. That cross-repetition issue is separate from the train/test group separation within a single partition. A card should state which property is being reported rather than using “non-overlapping” without identifying the sets and the unit of comparison.
A balanced set of objects can produce an unbalanced set of photographs
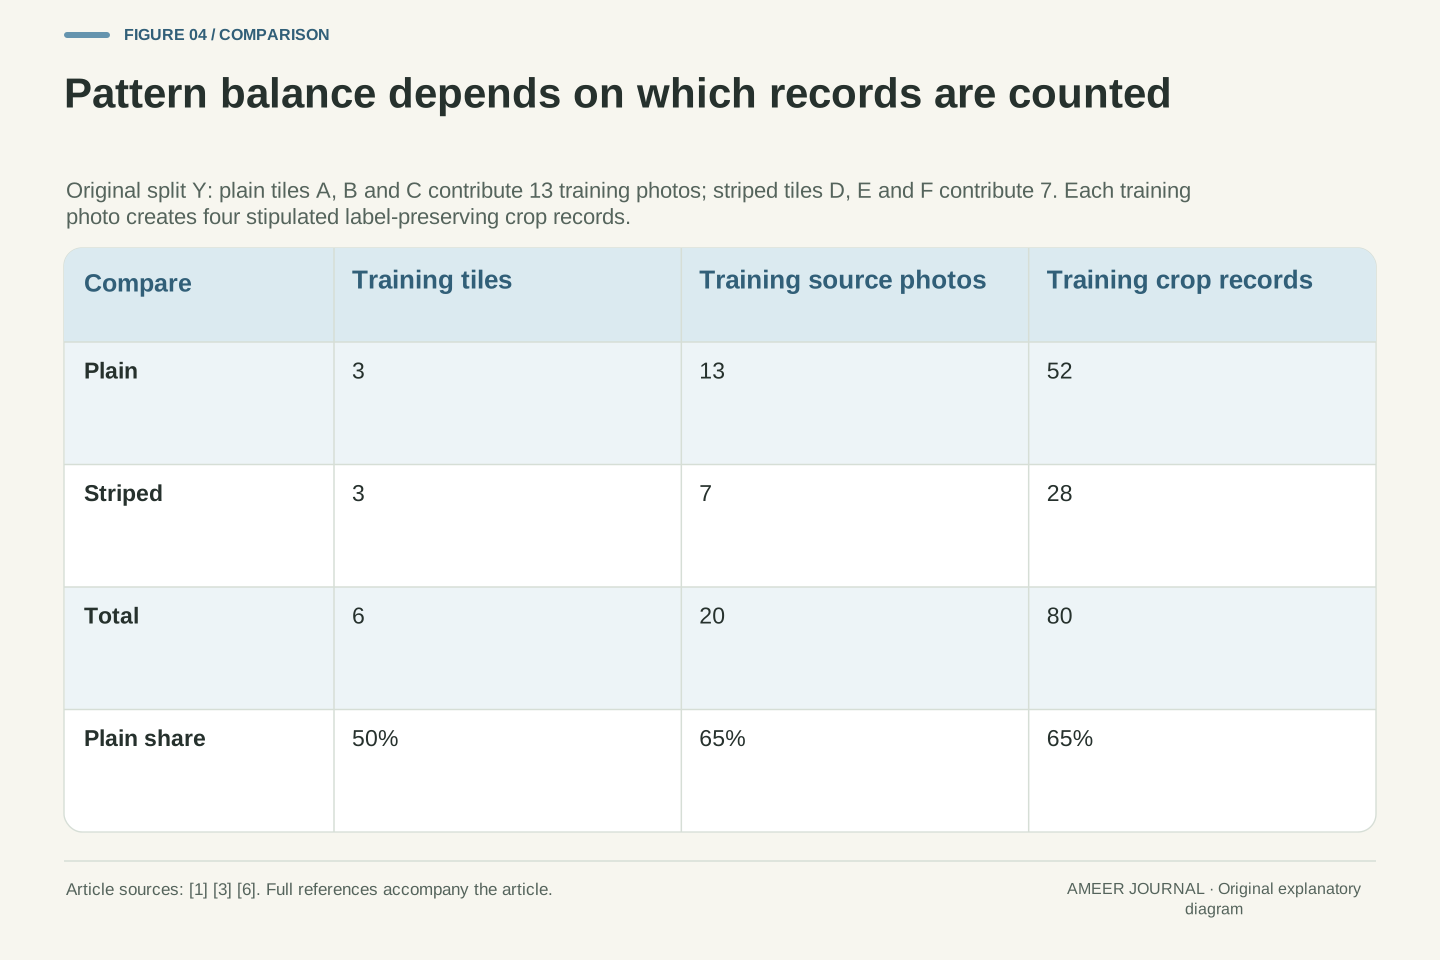
The six training tiles in split Y contain three plain tiles and three striped tiles. At the object level, the pattern counts are evenly divided. But the plain tiles A, B and C have six, four and three photographs: thirteen in total. The striped tiles D, E and F have three, two and two photographs: seven in total.
The plain share is therefore 3/6=50 percent when counting tiles and 13/20=65 percent when counting training photographs. No labels changed. The difference comes entirely from how many views each tile contributes. If a card simply says “balanced”, a reader cannot tell which statement it means.
Across the whole constructed collection, the corresponding counts are four plain and four striped tiles, but fifteen plain and nine striped photographs. Reporting both levels makes the collection design visible. It does not establish what balance a real application needs or whether changing the counts would improve a model. The card's composition and limitations sections provide a place to explain the sampling pattern. [1][3] A useful explanation preserves the counts rather than replacing them with a reassuring adjective.
Within Y_train, let the plain entities be A,B,C and the striped entities be D,E,F. Entity counts are 3 and 3, but row counts are 6+4+3=13 and 3+2+2=7. The empirical plain fraction is therefore 1/2 under uniform entity counting and 13/20 under uniform photo-row counting.
For all eight entities, the object-level counts are 4 and 4, while photo-level counts are 15 and 9. This is a deterministic weighting effect of the constructed multiplicities. It demonstrates that class composition depends on the unit and counting measure. It does not establish a population class distribution, infer actual training weights or prescribe a universally desirable balance.
A proposed card table should name its population and unit: all source photos, training source photos, training entities or derived training records. The datasheets proposal and card template motivate documenting composition and limitations [1][3]; the exact tables here are our own construction. If a training procedure later uses sampling or weighting, that procedure requires its own description. Merely observing equal entity counts is insufficient to infer equal contribution to an objective, especially when each entity contributes a different number of rows.
Four crops per photograph change the row count, not the object count
Apply a new rule to split Y: create four crop records for each of its twenty training photographs. Keep the four test photographs as original-view records. The training set now has eighty rows and the test set still has four, giving eighty-four model-input records. Every crop retains its parent photograph and tile identifier. No new tile has entered the construction.
This kind of change in table size is supported by batch processing tools. The Hugging Face batch-mapping guide explains that an input batch of N examples can produce M examples, with M larger or smaller than N. [6] The transformation's meaning still needs documentation. In our hypothetical pattern task, we stipulate that the chosen crops preserve the relevant label; an actual crop that removes the distinguishing pattern would need separate treatment.
Storage can introduce yet another count. If all twenty-four original image files were retained and eighty new crop files were added, there would be 104 stored image files. That assumes the four test originals are referenced in place and no other image copies exist. Our local example constructs only the corresponding records. A card should identify the processing stage behind each count so that files, derived inputs and independently photographed objects are not accidentally added together.
Transform the twenty Y_train photo records into four derived records each, preserving parent_photo_id and tile_id. Keep Y_test as four original-view records. The resulting training cardinality is 80 and total model-input cardinality is 84. The training class counts become 52 plain and 28 striped, retaining the source-row proportion 13/20 because the same expansion factor applies to every training photograph.
The pinned Datasets v4.8.1 batch-mapping guide permits N input rows to produce M output rows; returned fields within one output batch must have consistent lengths [6]. That structural requirement does not establish semantic validity or independent observations. Our inherited pattern labels assume the stipulated crops preserve the relevant feature. We have not generated or inspected image crops and make no augmentation-benefit claim.
The proposed lineage keeps derived records inside their parents' assigned split. If twenty-four originals and eighty distinct crop files were stored, with the test originals referenced rather than copied, the image-file count would be 104. That is a storage-accounting scenario, not a count of source observations. A card should record input revision, transformation rule, parent relation, resulting schema and per-split counts. These details make the change in cardinality reproducible without interpreting the extra rows as extra physical coverage.
A missing quality flag is not a clean photograph
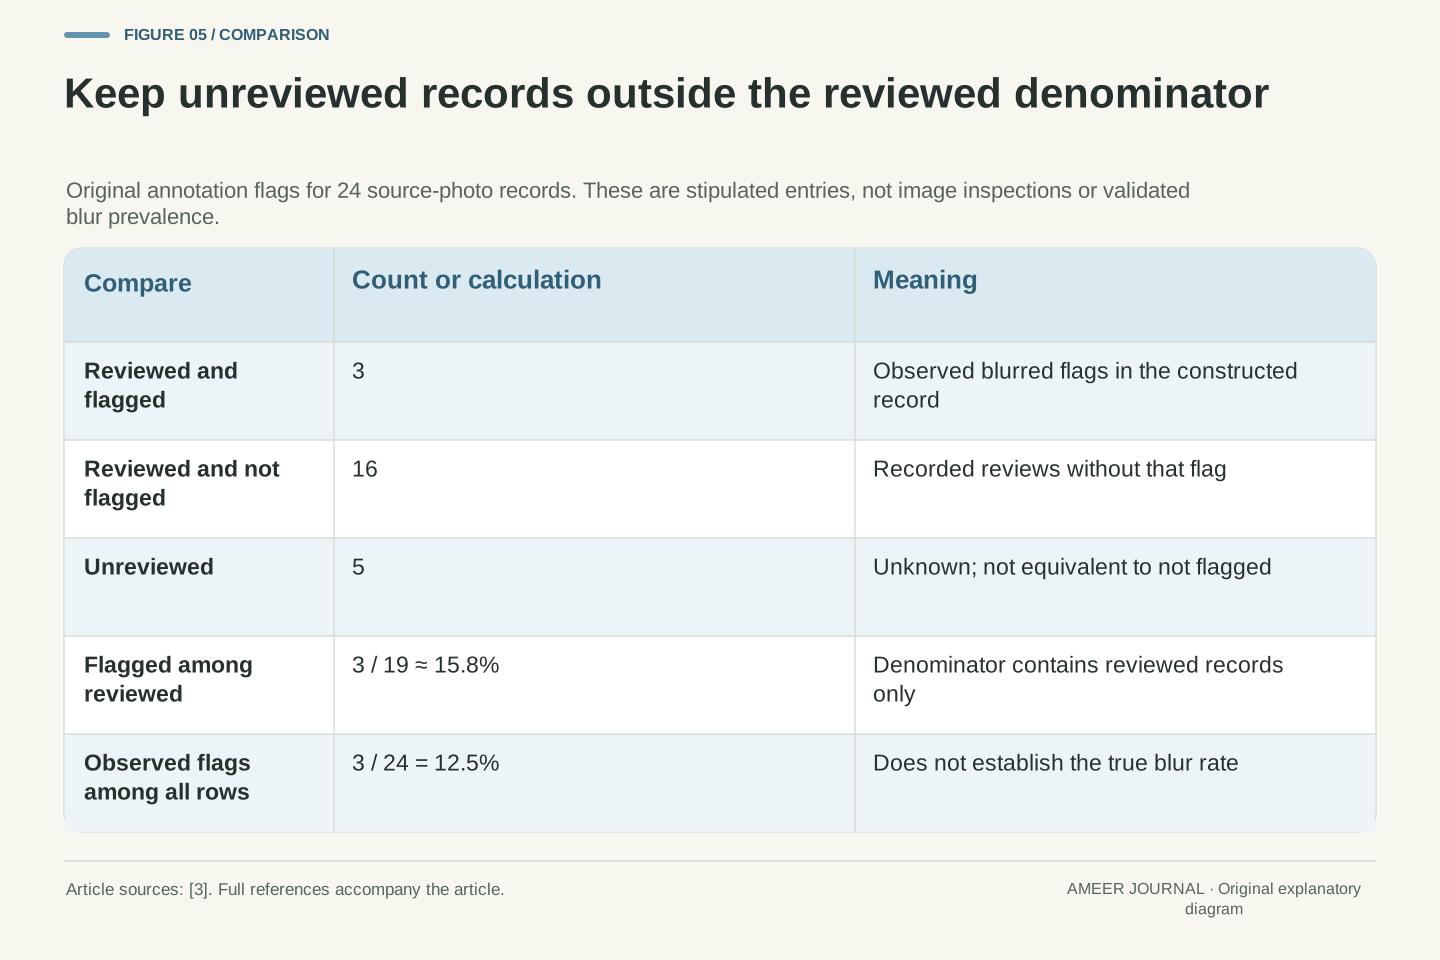
Add a separate, invented annotation record. Nineteen of the twenty-four source photographs have a recorded quality review. Three of those nineteen are flagged as blurred and sixteen are not flagged. The remaining five have no recorded review. These are stipulated labels for our example, not observations made from real images.
The flagged share among reviewed photographs is 3/19, about 15.8 percent. The share of all source records carrying that flag is 3/24, or 12.5 percent. Both calculations can be reported, but they answer different questions. The second does not establish that only 12.5 percent of the entire collection is actually blurred, because five entries are unreviewed and the flag itself has not been independently validated.
Keep the unknown state visible. If a blank is silently converted to “not flagged”, the card would describe twenty-one unflagged photographs rather than sixteen reviewed-and-unflagged photographs plus five unknowns. That changes the meaning without inspecting anything new. The template asks for annotation methods, amounts, guidelines and validation. [3] Those details are what let a reader judge a label count. A missingness convention belongs beside the field definition, not hidden in a later troubleshooting note.
Stipulate a source-photo quality_flag with three states: blurred for 3 records, not_flagged for 16 records and null for 5 unreviewed records. The reviewed subset has cardinality 19. Thus P_emp(flagged | reviewed)=3/19≈0.157895, while the fraction of all source rows with an observed blurred flag is 3/24=0.125. Neither is a validated estimate of actual blur prevalence in a target population.
Converting null to not_flagged collapses distinct annotation states and changes the resulting count from 16 to 21. No additional review has occurred, so that transformation would manufacture a negative interpretation for five unknown entries. Record whether null means unassessed, unavailable, inapplicable or something else; these meanings are not interchangeable merely because a table can encode them with the same missing-value marker.
The inspected template requests annotation process, coverage, guidelines and validation information [3]. Our original example answers only the declared counting question. It supplies no inter-annotator agreement or accuracy evidence. A useful card separates the annotation population, decision rule and validation status from the class label used for the main task. Otherwise a user may mistake a complete-looking column for complete review coverage, or treat a recorded flag as verified ground truth without the supporting assessment.
Keep the card attached to the exact data revision it describes
A card can be accurate when written and become misleading after the dataset changes. Suppose a maintainer corrects a label, removes a photograph or changes the crop rule. The counts and explanation may then need an update, even if the dataset keeps the same public name. Record which data revision each card describes and what changed from the previous one.
Hugging Face's loading guide supports choosing a dataset revision using a branch, tag or commit reference. [5] For a precise record of what was inspected, retain the resolved commit and the actual input artifacts, rather than relying only on a moving branch label. Also retain the transformation settings and output manifest when derived records are created outside the source repository.
Loading configuration answers another limited question. The documented data_files mapping can associate particular files with names such as train and test. [5] That makes the files load into named splits; it does not explain why their records were assigned there. Our split X and split Y could both use files with those names while preserving very different tile relationships. Put the assignment rule and membership record in the card as well as the loading instructions, so that a successful load does not become an unsupported claim about the split design.
Treat a documentation statement as applying to a specified artifact state. A source-row deletion, annotation correction or transformation change can alter cardinalities or semantics while leaving a repository name unchanged. Our proposed record links card revision, dataset revision, source manifest and transformation configuration, with a change log describing which assertions need recomputation.
The loading guide documents the revision parameter and branch, tag or commit references [5]. Recording a resolved commit identifies the repository state more precisely than retaining only a moving branch name. For independently generated outputs, preserve the actual artifacts or their content identifiers and the processing context as well; the source revision alone does not describe an unrecorded transformation.
The same guide documents data_files mappings to named splits [5]. That is a loading arrangement, not evidence of how the partition was constructed. A file named test.csv could encode X_test or Y_test; successful loading does not distinguish their entity overlap. Retain membership and assignment criteria separately from serialization and loader configuration. If label codes are mapped to names, keep that mapping with the schema too: a numerically unchanged column can acquire a different interpretation if its codebook is silently replaced.
State which questions the collection can actually help answer
Our imaginary tile records support exact questions about counts, grouping and transformations. They do not contain photographs, camera settings or lighting measurements. We therefore cannot claim that they cover outdoor conditions, unusual surfaces or a particular camera. A useful card says what is missing rather than filling those gaps with a broad statement such as “works in real-world conditions”.
For an actual collection, the intended use determines which collection details matter. If a project needs to recognize previously unseen objects, the object-level split becomes relevant. If it needs to handle a new capture setting, a split that separates objects but shares the same setting may leave another question unanswered. The card should describe the observed conditions and limitations clearly enough for the reader to see that gap. The template includes intended-use, out-of-scope-use and limitations prompts. [3]
Documentation also distinguishes a collection's design from a model's measured results. A model can only be assessed through an appropriately defined evaluation. A detailed card helps someone design or interpret that evaluation; it does not replace it. In our construction, the appropriate claim is that the membership and denominator calculations are reproducible. We have no image-recognition accuracy, robustness or representativeness result to attach to them.
Define the intended question before interpreting coverage. The constructed manifest contains entity identity, source-photo identity, pattern and stipulated quality flags. It contains no actual pixel data or acquisition-condition measurements. Assertions about illumination, camera diversity or deployment environments are therefore outside its evidence, regardless of how many derived records are listed.
Entity-disjoint Y addresses overlap at the tile identifier, but does not establish separation by an unrecorded session, device or environment. A real card should name the relevant collection units and conditions so a consumer can judge whether the partition matches the intended use. The inspected template includes suitable uses, out-of-scope uses and technical limitations [3]; these sections can expose a mismatch instead of concealing it behind a broad suitability claim.
Documentation describes data and its provenance; model evaluation requires additional outputs, outcomes and a declared protocol. Our exact set intersections and counts are verifiable properties of the synthetic manifest, not a predictive-performance result. Similarly, a complete description does not independently establish representative sampling or correct annotation. The useful boundary is to report what the collection record supports and identify which evidence another application would still need before using the data to answer its own question.
Read the card by following one row back to its source
Try a concrete reading exercise. Start with training record A-02/crop-3. The proposed manifest tells you that it came from photograph A-02, which depicts tile A. Split Y assigns tile A to training, and the four-crop rule explains why that photograph contributes several input rows. The pattern label follows the stipulated tile label, while a source-photo quality flag remains a separate piece of information.
Next, compare test record G-01/original. It points to tile G, which has no training photograph in split Y. The record is an unchanged test view, so it does not pass through the training crop expansion. A reader can now explain why the table has eighty training records and four test records without imagining that eighty-four different tiles were observed.
This is the practical value of a dataset card with connected definitions: it lets a reader trace a claim. The card should make the counting unit, identity relationships, split rule, transformation, annotation state and revision easy to find. [3][5][6] When one of those links is missing, name the unanswered question precisely. Asking “Does this 25 percent refer to tiles or photographs?” is more useful than accepting or rejecting a dataset because its headline count looks large.
Trace the constructed record A-02/crop-3 through parent_photo_id=A-02 to tile_id=A. Its lineage establishes membership in Y_train and participation in the four-output transformation. The inherited pattern field and the source-photo quality annotation have different declared levels. No inference about pixel quality is needed to verify these referential relationships.
Contrast G-01/original in Y_test. Its parent entity G is absent from Y_train, and the test record remains an original-view input rather than one of the eighty training crops. The manifest therefore supports both a row-cardinality statement and an entity-overlap statement, with their distinct denominators. These are concrete properties a consumer can reproduce from the retained identifiers.
Our proposed documentation combines the template's field and relationship descriptions [3], the loading guide's explicit artifact selection [5] and the batch guide's variable-cardinality processing model [6]. The original record design supplies the connections between those ideas. A consumer can inspect a row, recover its source and split context, and identify whether a requested statistic concerns entities, observations or derived inputs. If a link or assessment is absent, the card should expose that absence rather than silently promoting a storage or formatting property into evidence about data quality.
Sources & further reading
Explore the references behind this guide. External pages may change after our review.
- Datasheets for Datasets - Microsoft ResearchTimnit Gebru and coauthors / Microsoft Research · Accessed 7 Nov 2026
- Dataset Cards · Hugging FaceHugging Face · Accessed 7 Nov 2026
- Default dataset card templateHugging Face Hub developers · Accessed 7 Nov 2026
- GroupShuffleSplit — scikit-learn 1.9.1 documentationscikit-learn developers · Accessed 7 Nov 2026
- Load · Hugging FaceHugging Face Datasets developers · Accessed 7 Nov 2026
- Batch mapping · Hugging FaceHugging Face Datasets developers · Accessed 7 Nov 2026
Article updated 7 Nov 2026.
Found something we should revisit?
Good explanations get better with thoughtful feedback.